30 Day Map Challenge Pt.3

This is the Third post covering days 21-30 of the 30 Day Map Challenge. The first 10 days were previously posted and the Middle 10 days were as well. As a reminder, these are the themes
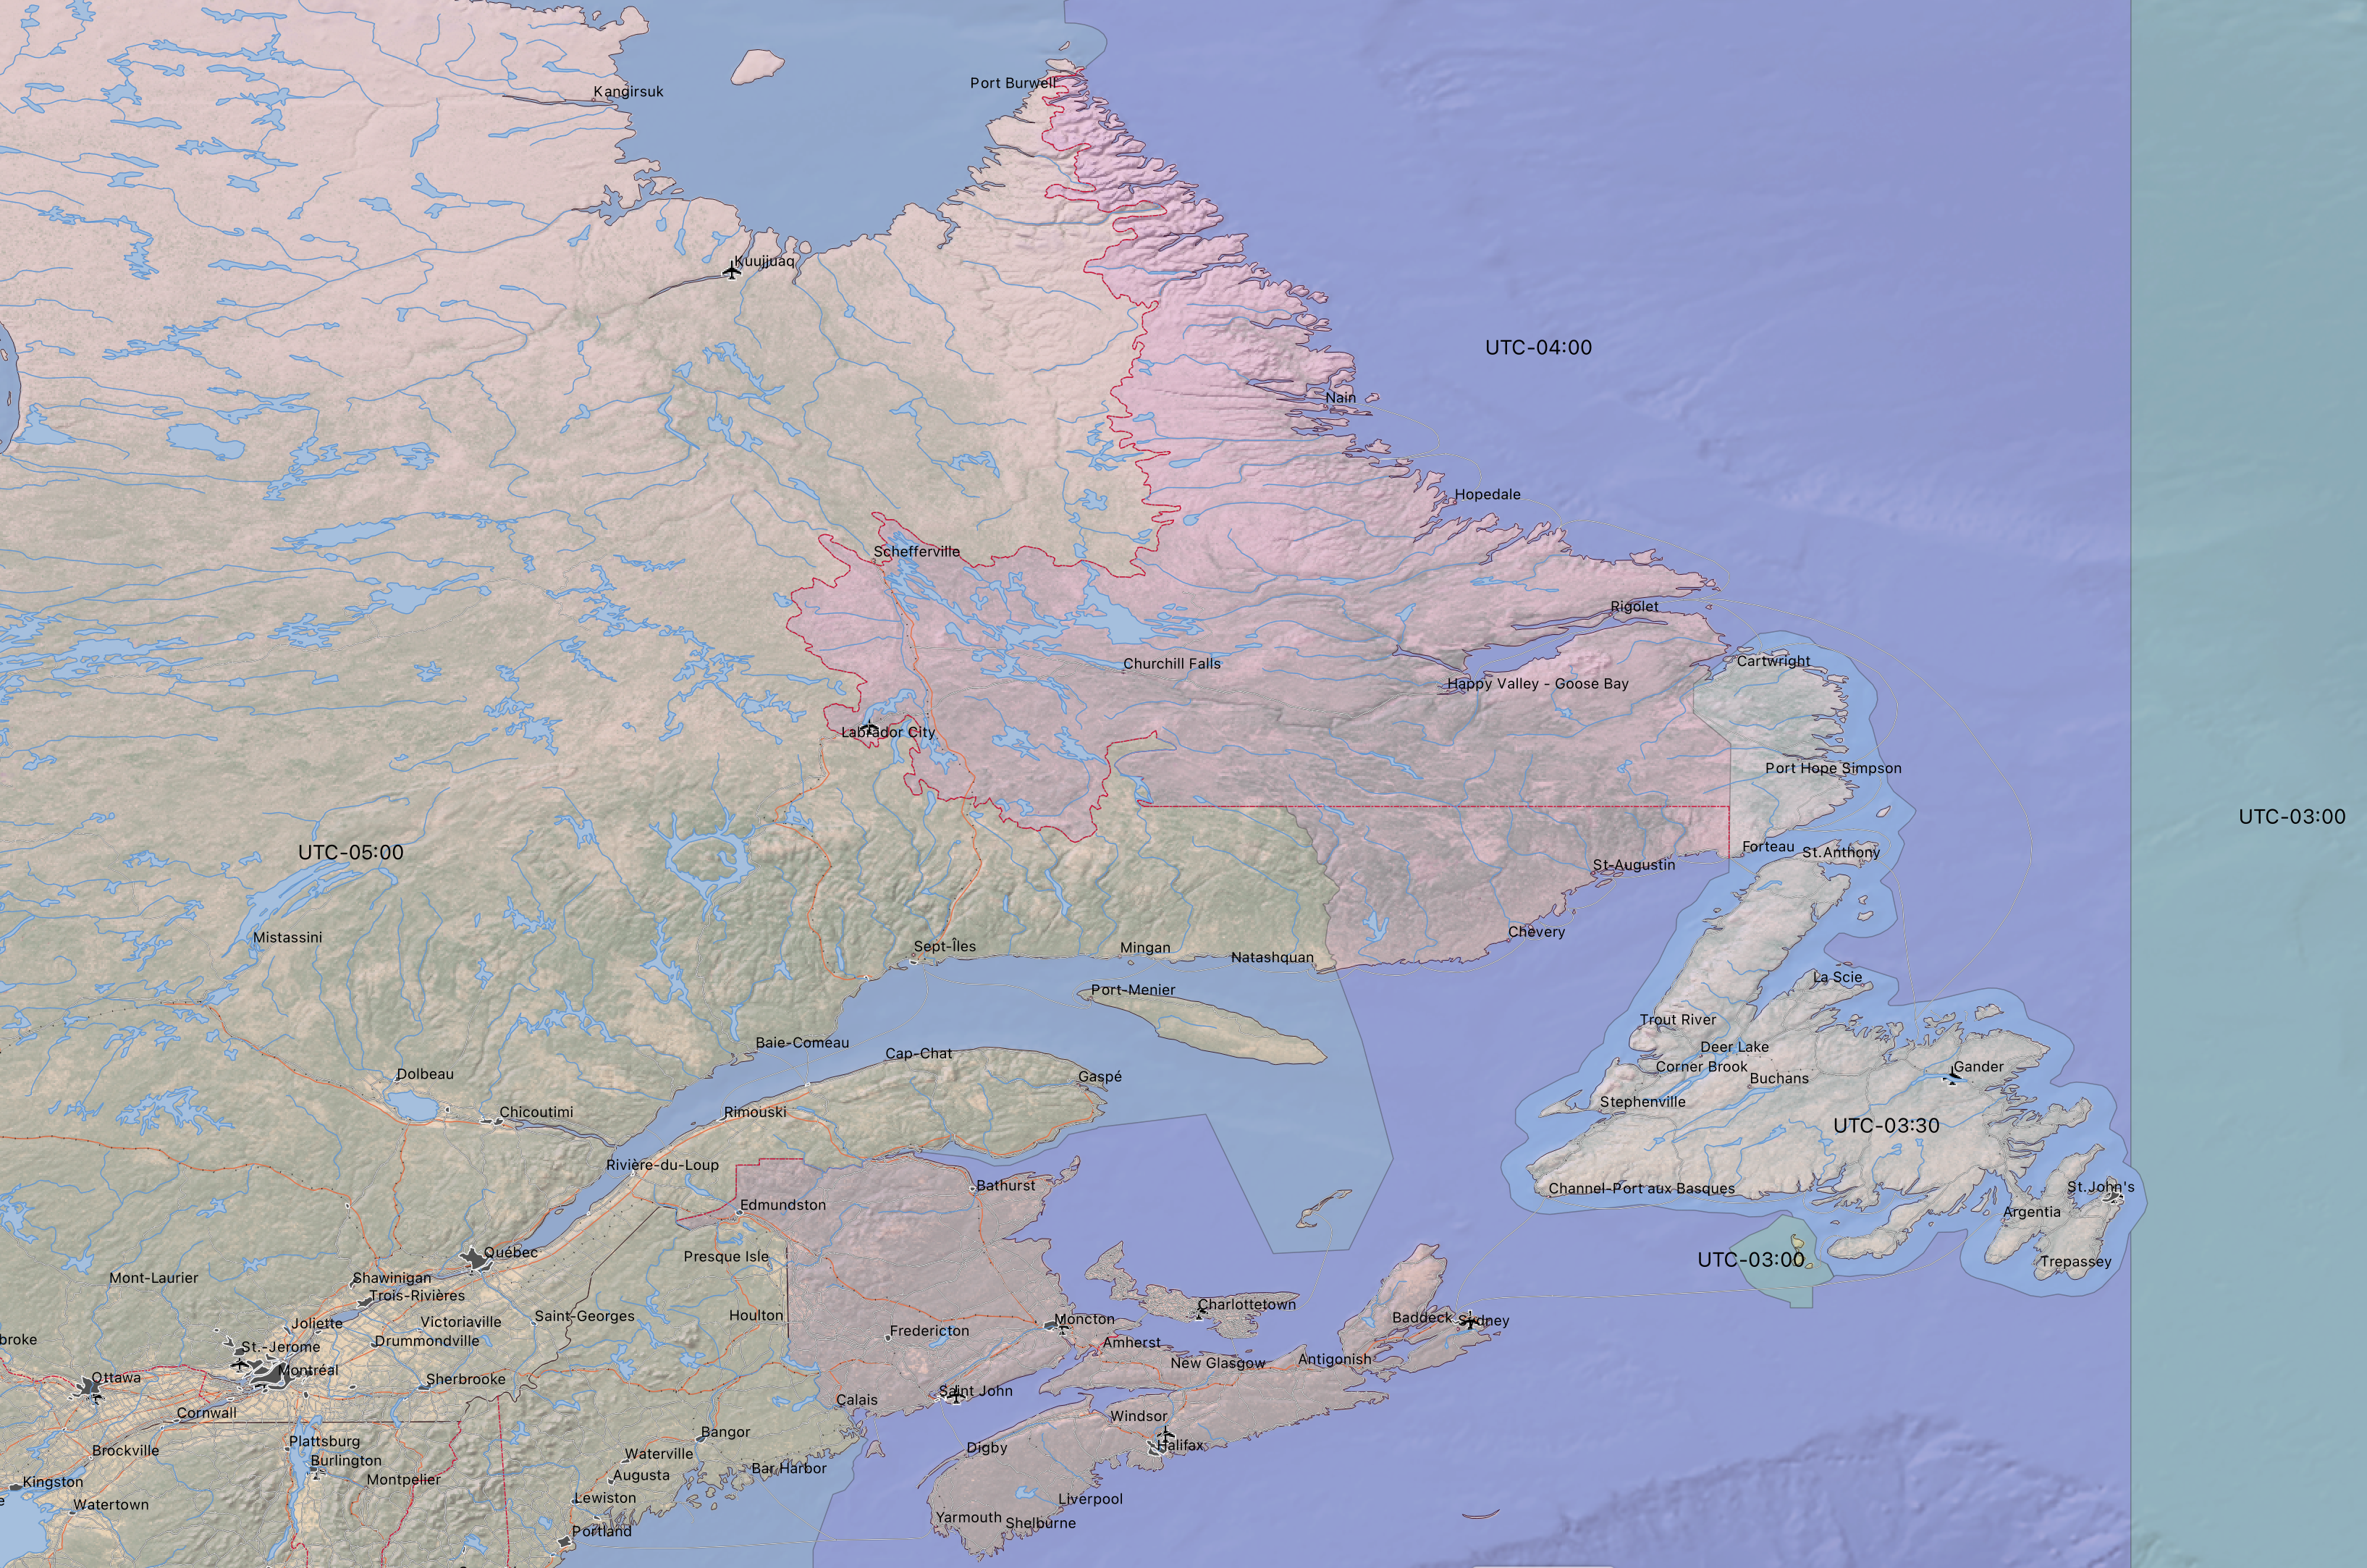
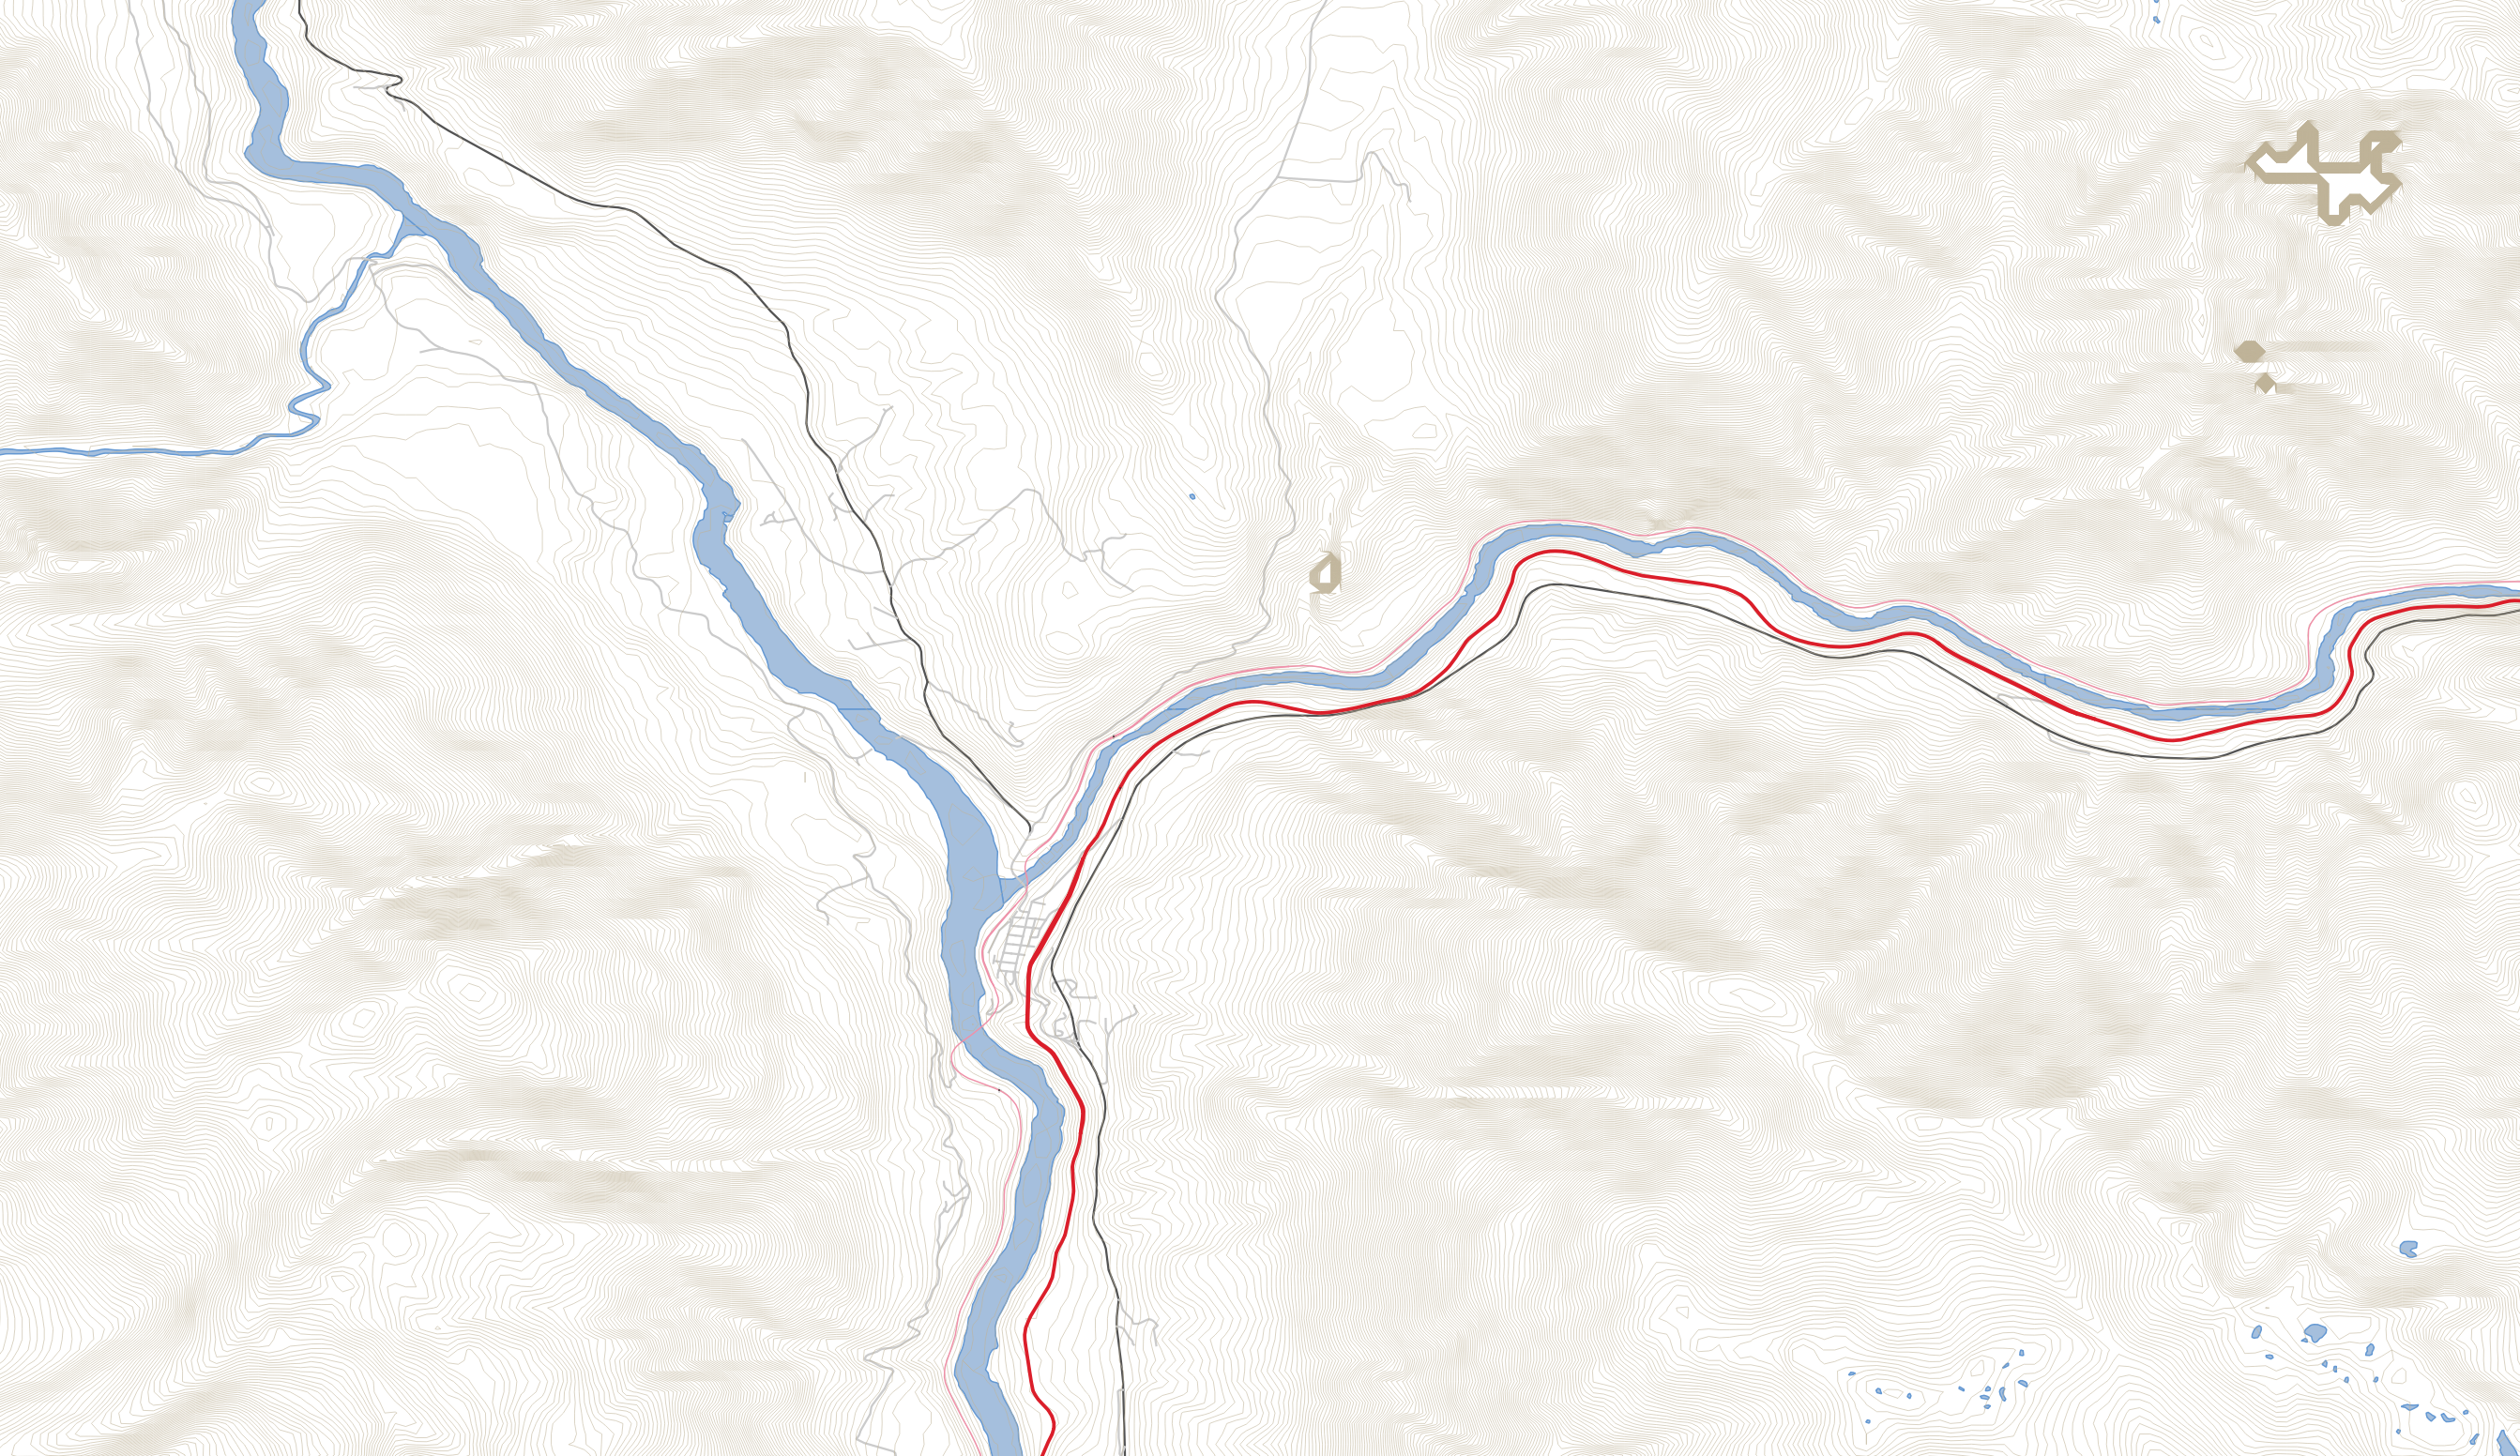
Day 21 – Elevation
Lytton BC, in the Frasier valley. This was generated with CANVEC Transport data, BC Water course Data, and the terrain is from SRTM.
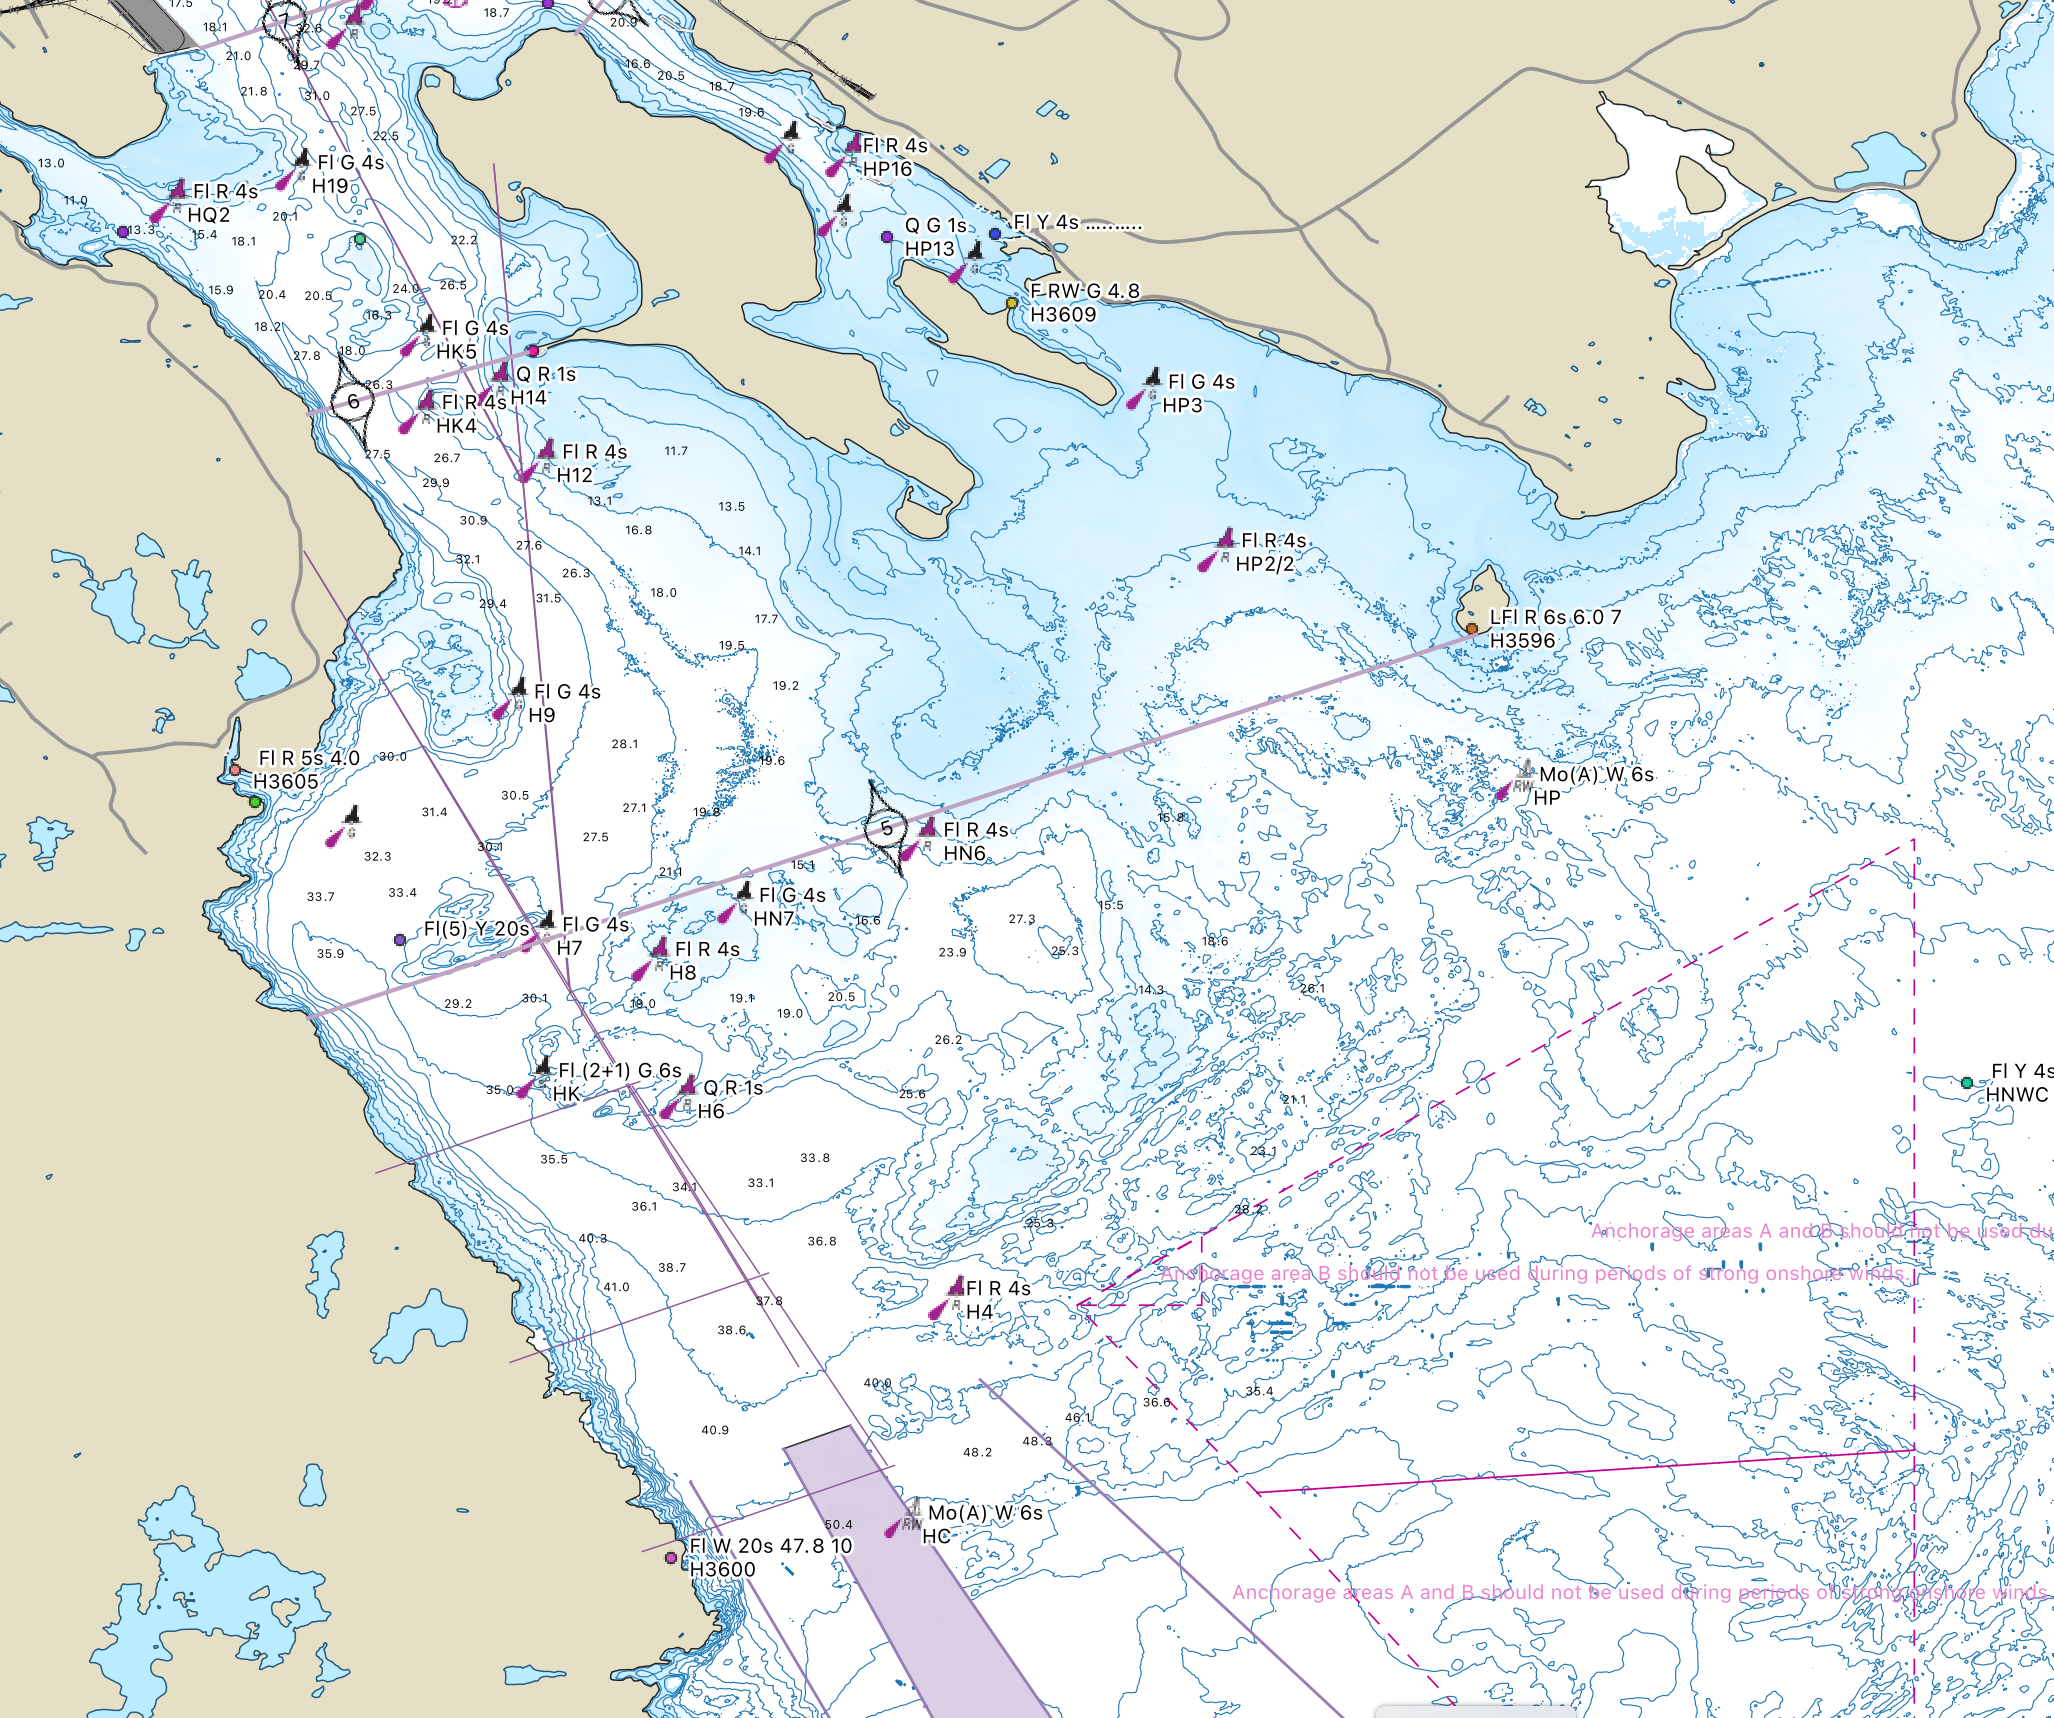
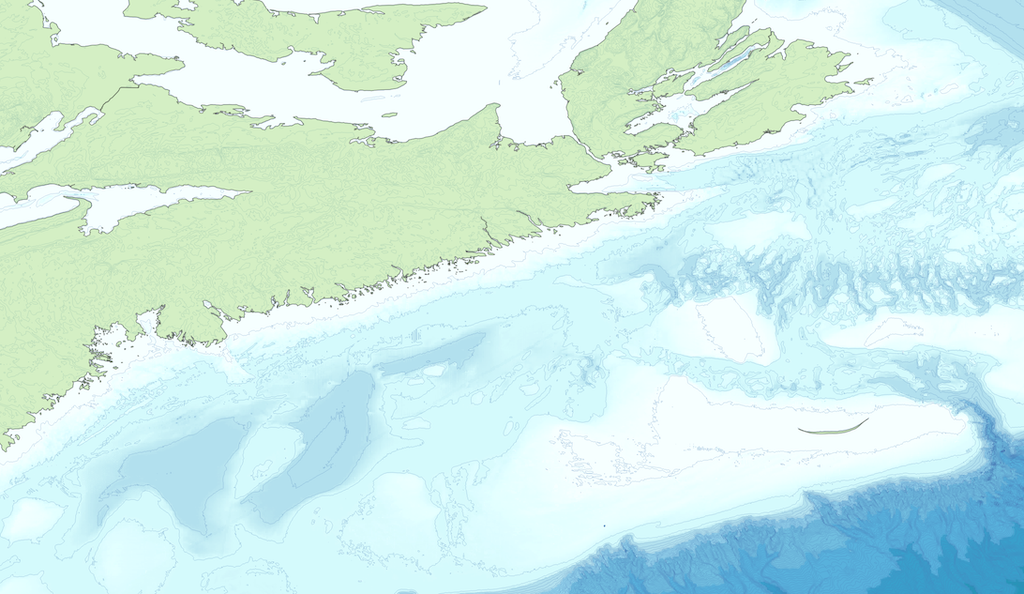
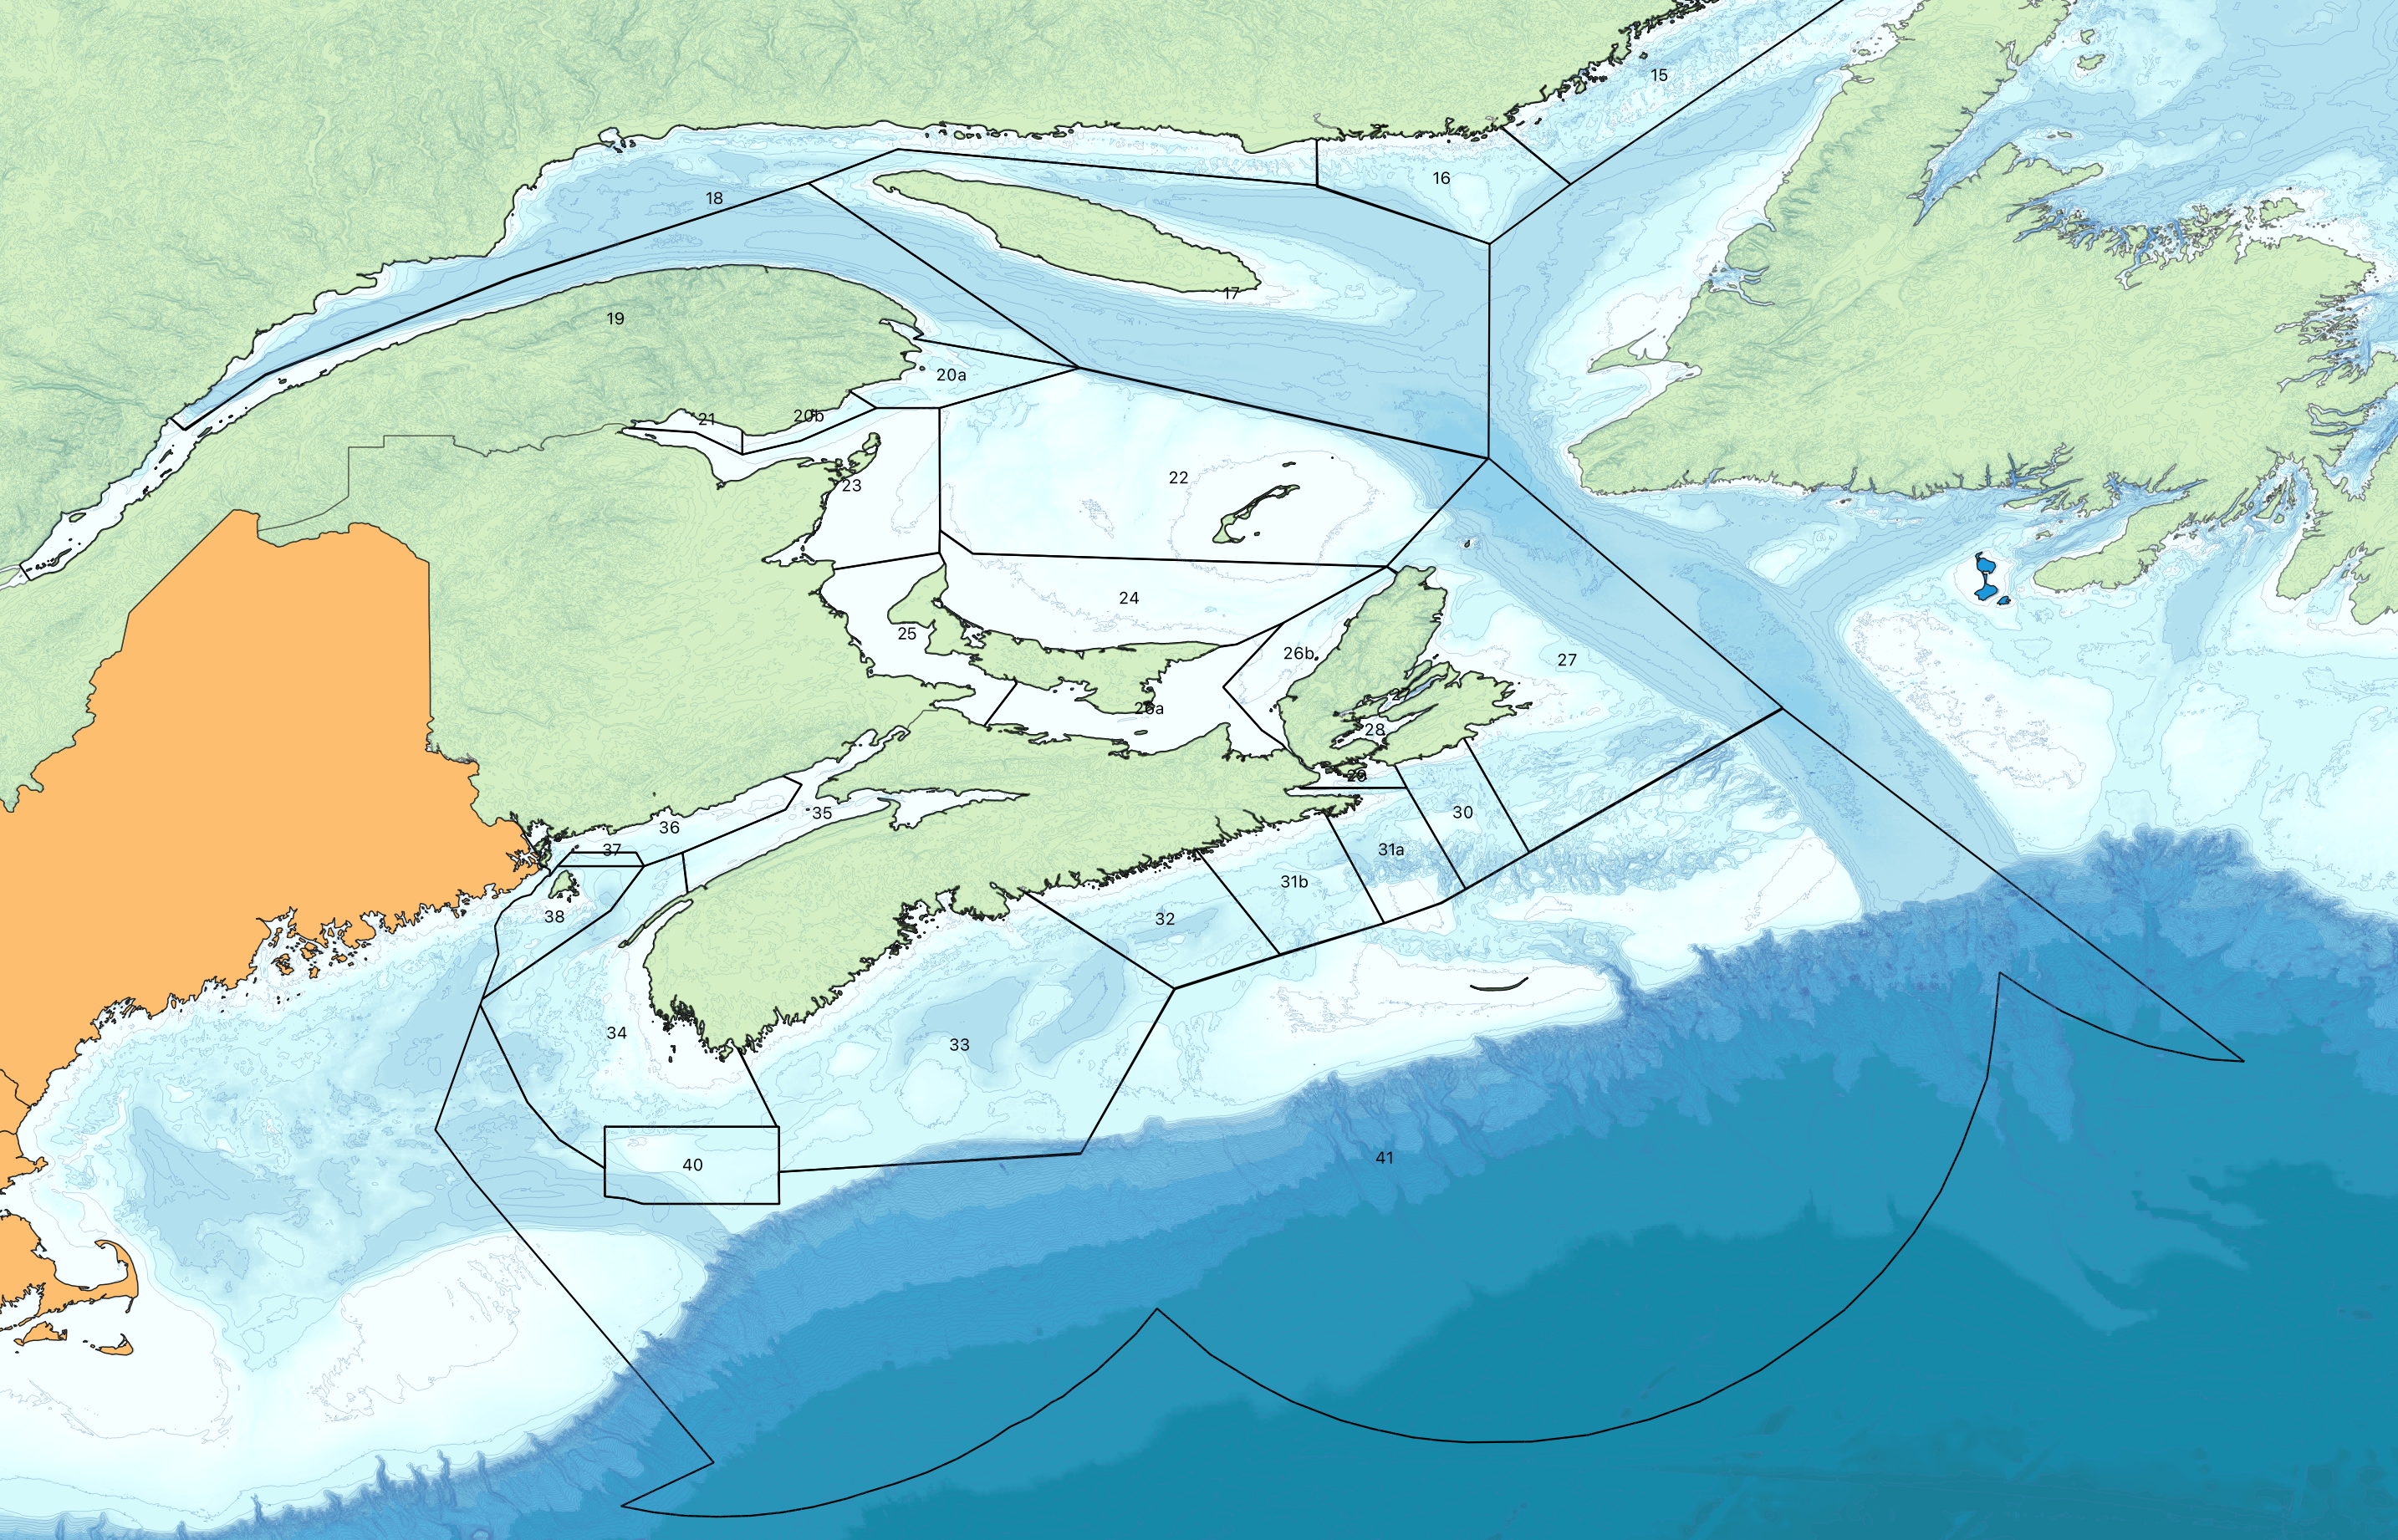
Day 22 – Boundaries
Atlantic Canada Lobster fishing areas. Each is defined in legislation, but there are no published shapefiles. Bathemetry is from Gebco.

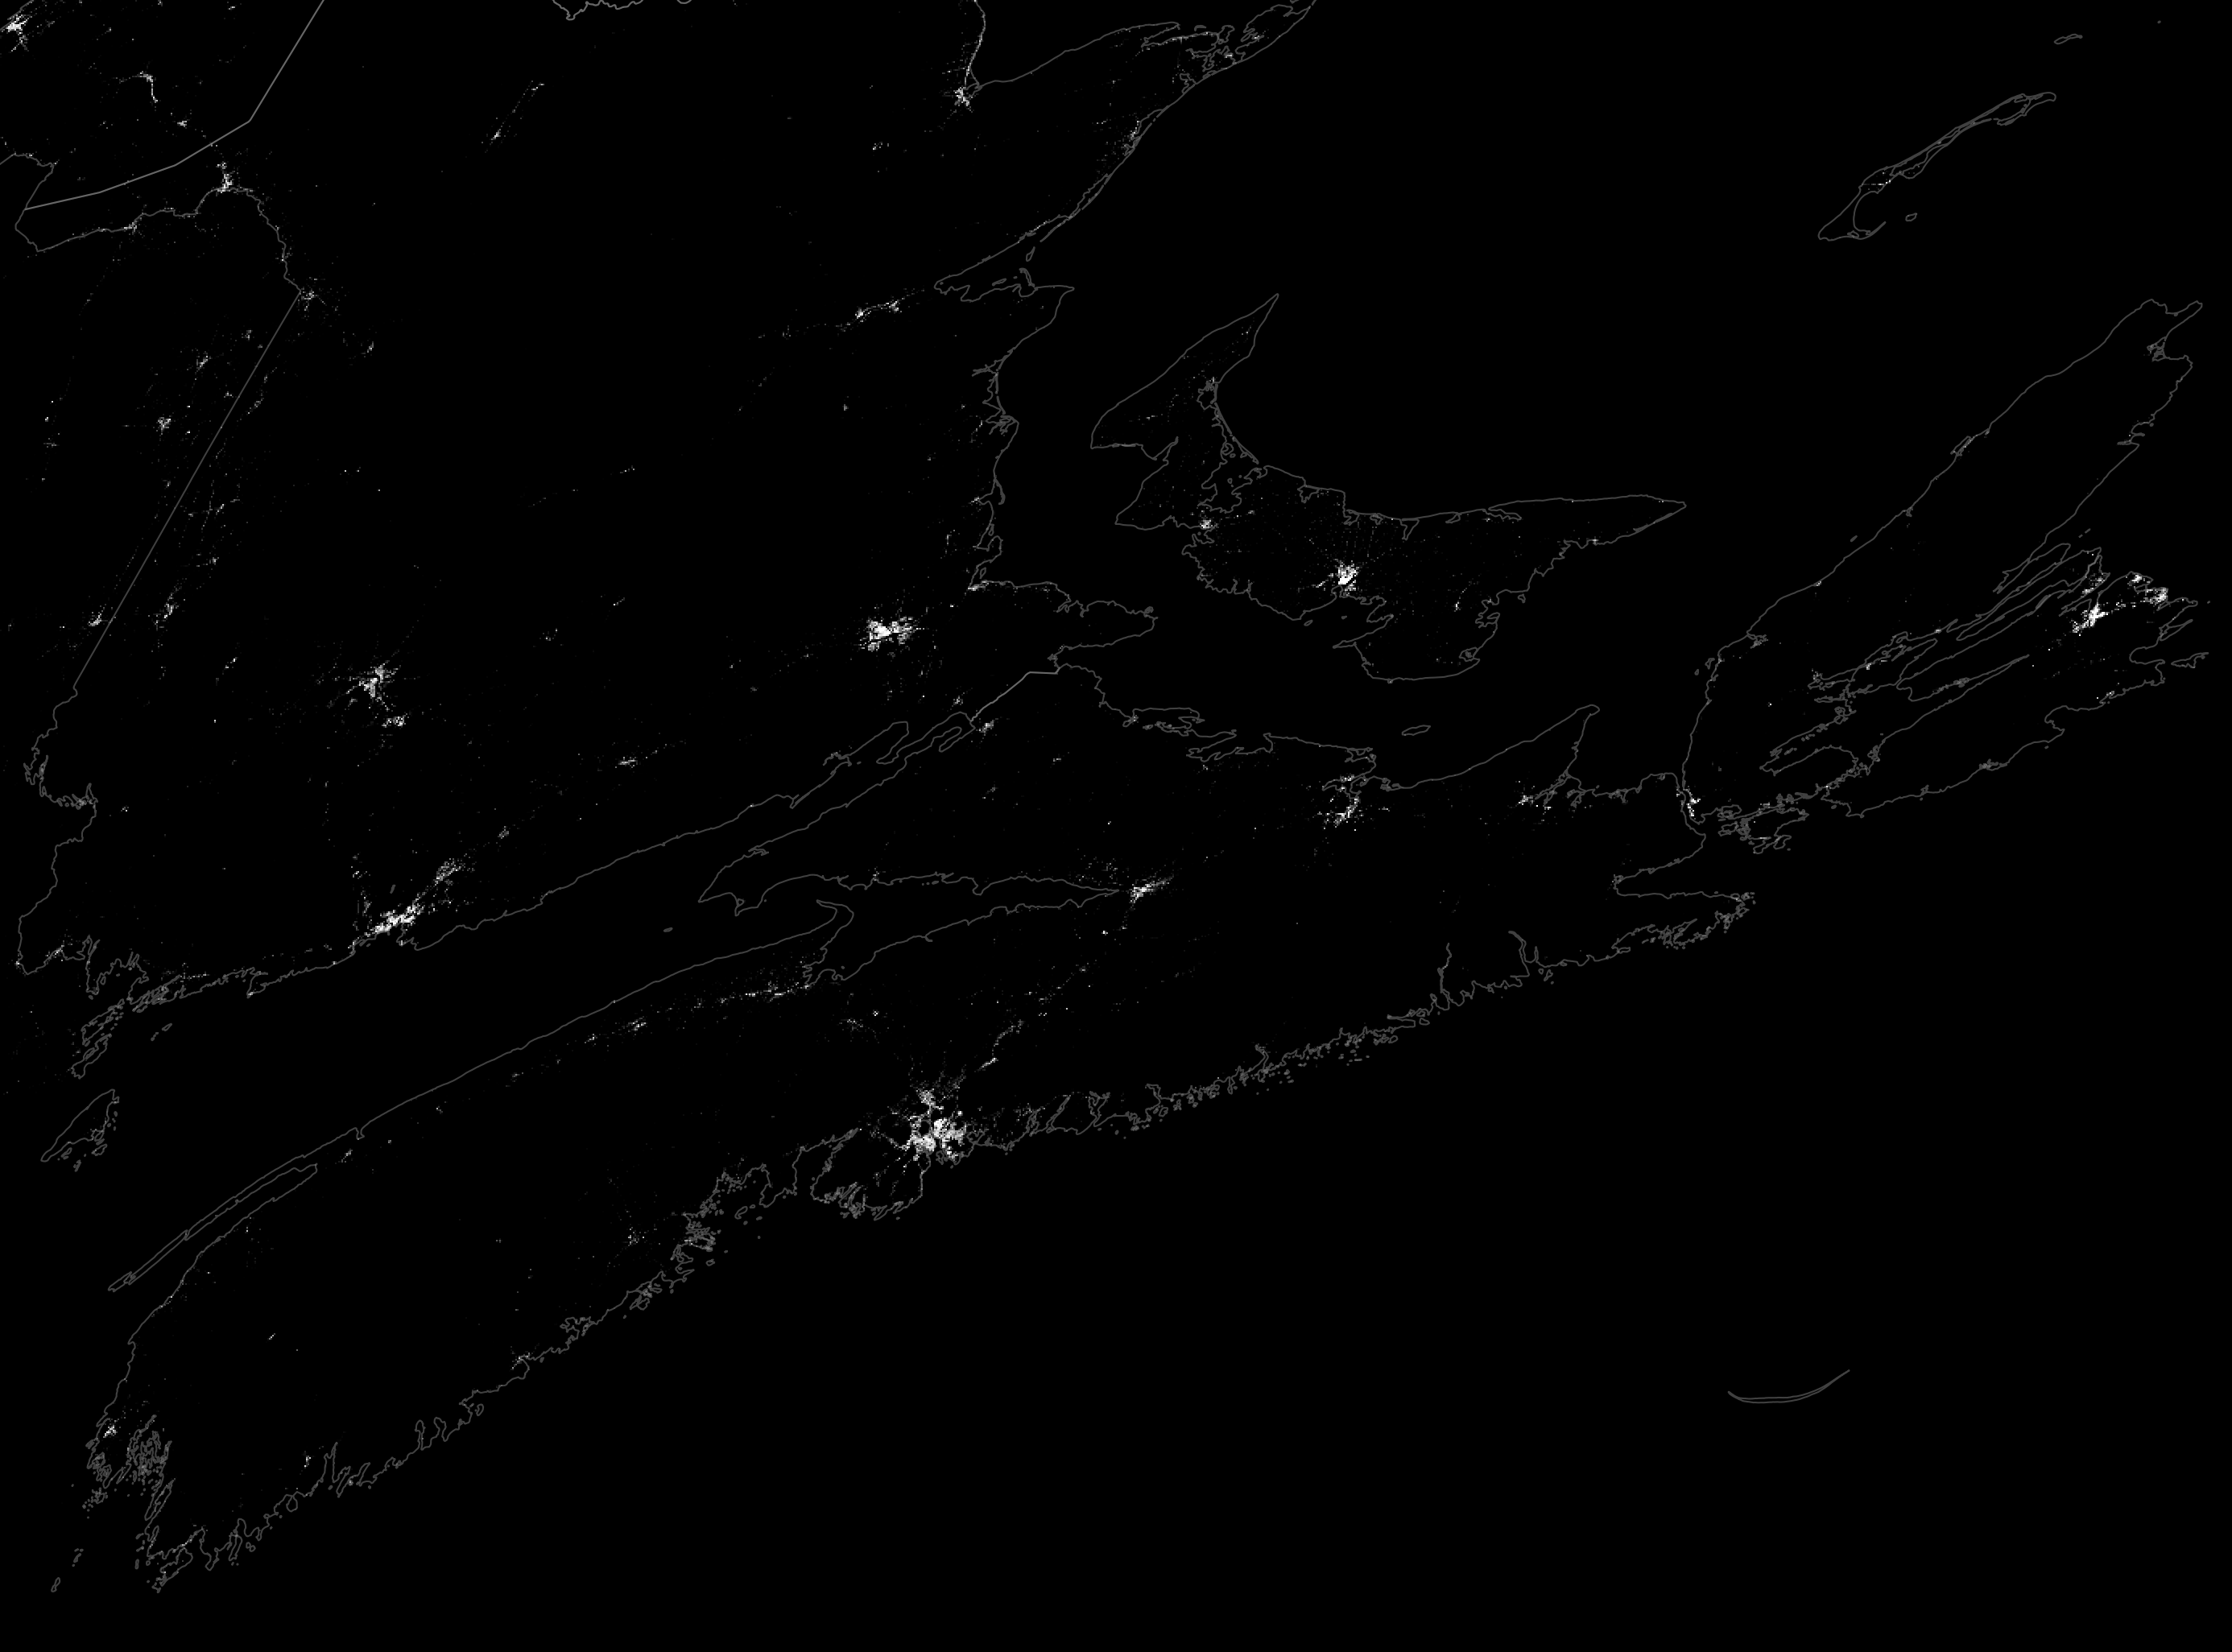
Day 23 – Global Human Settlement Layer
GHSL is a data set of where people live. I treated it as urban light at night.
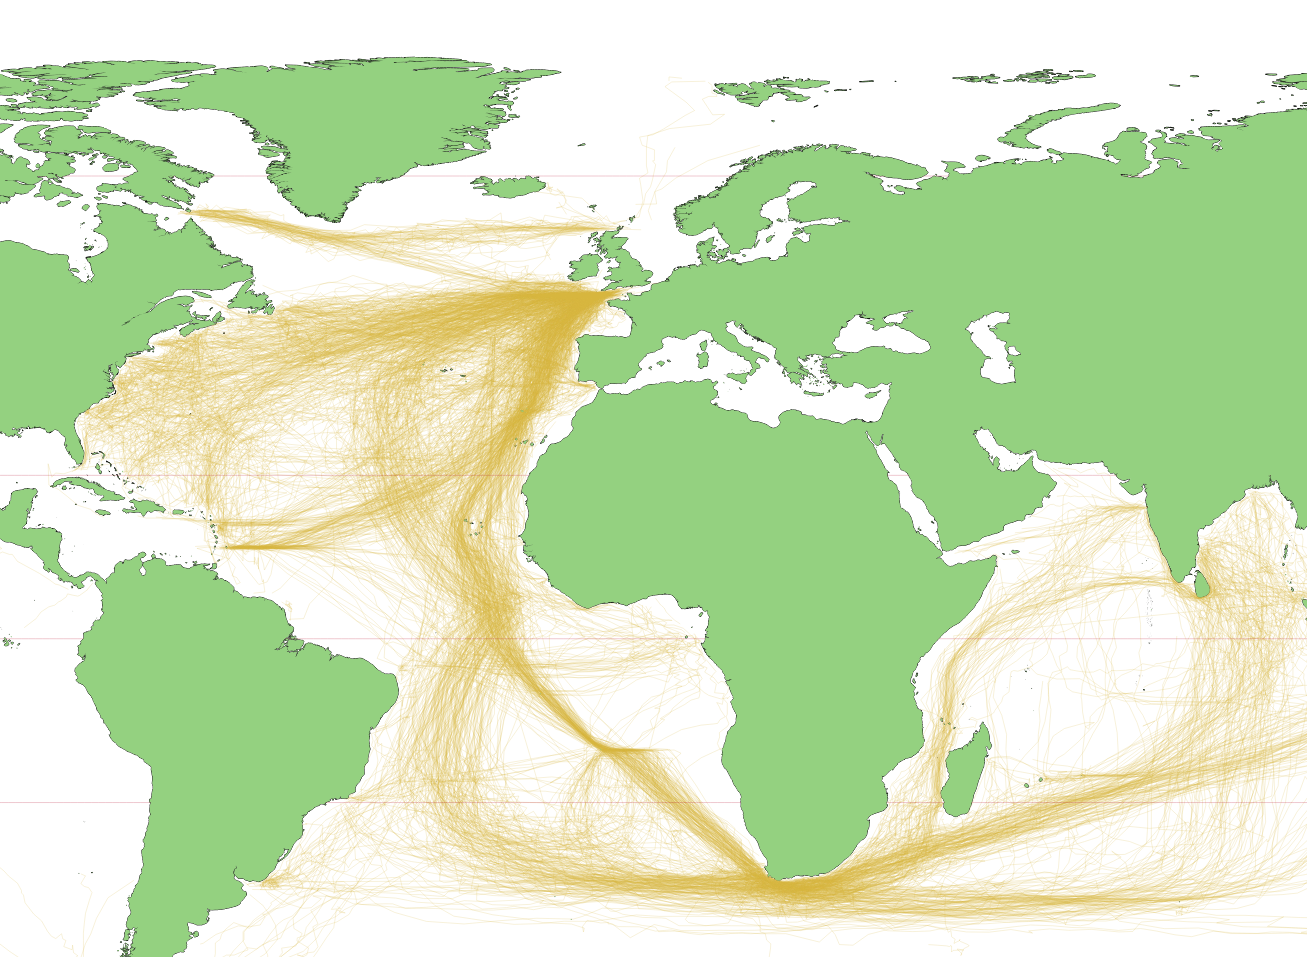
Day 24 – Historical
I made use of the CLIWOC dataset derived from ships logs to plot the main sea routes in use 1750-1850. These only show British ships, and you can see how the prevailing winds affected chosen routes, and the effects of the lack of a reliable way to determine longitude. the world data is from Natural Earth

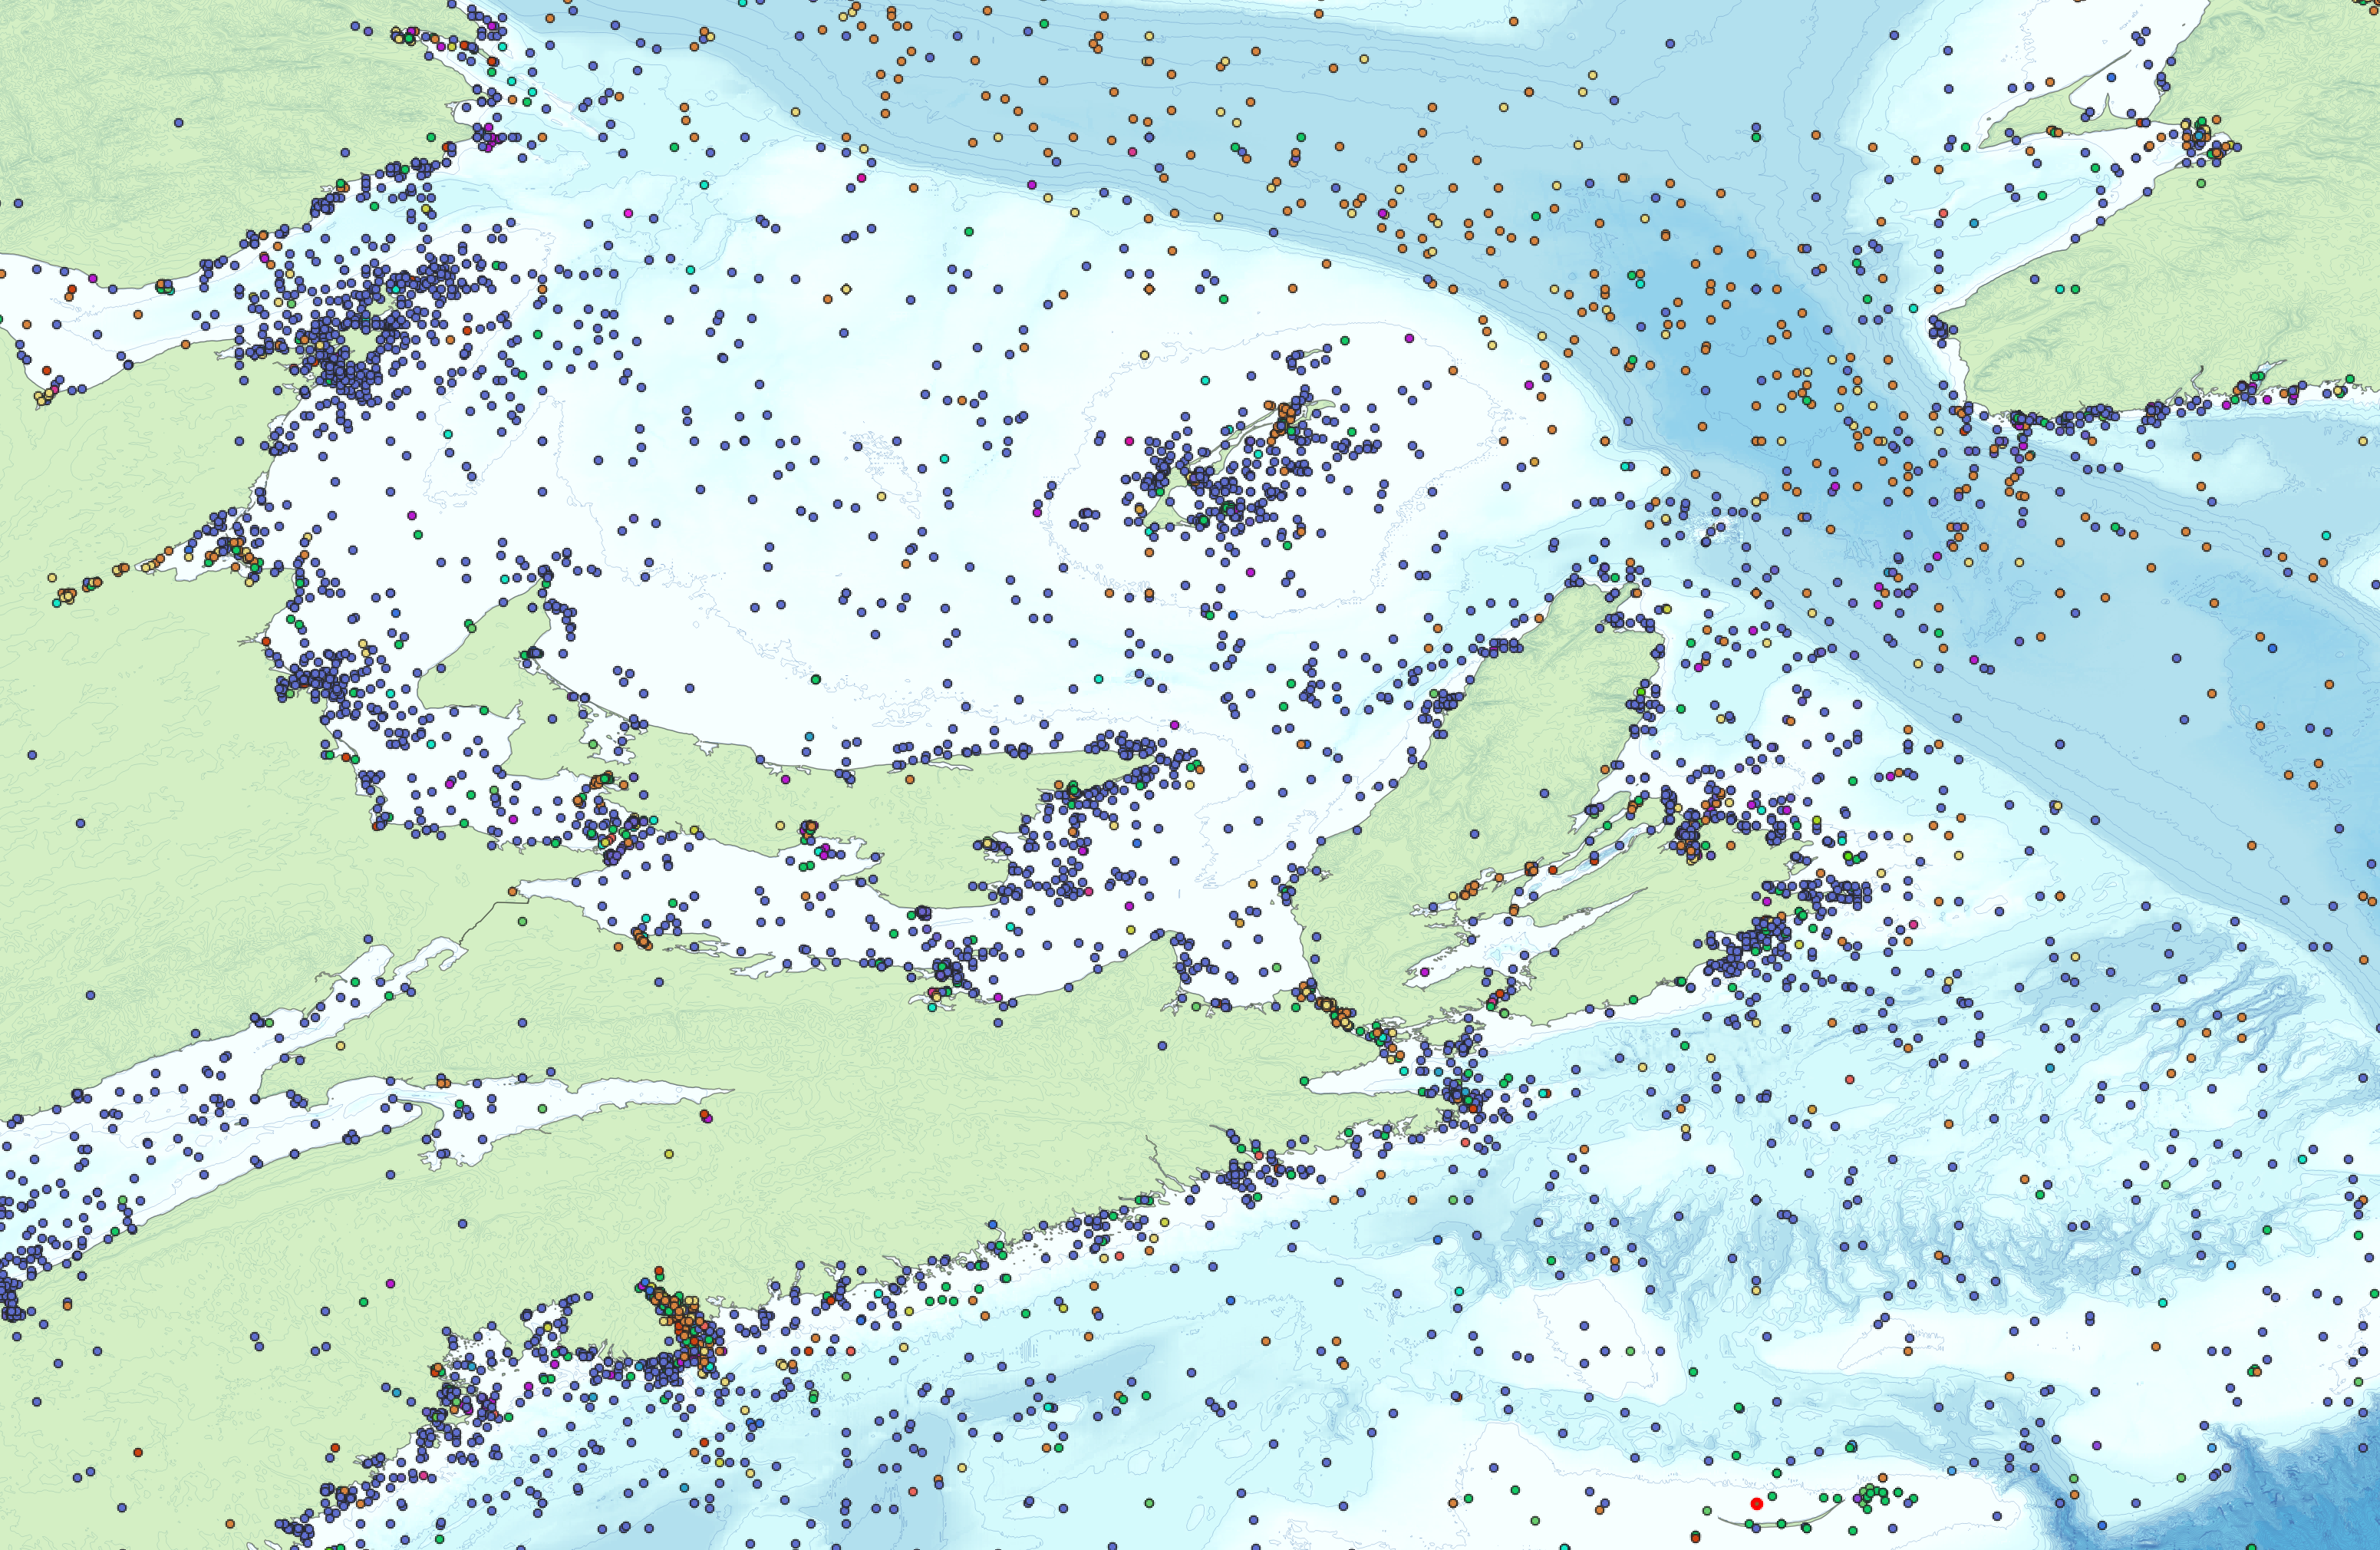
Day 25 – Interactive
Day 1’s point map, but clickable and done in Leaflet.js. check it out at Atlanticmx.ca
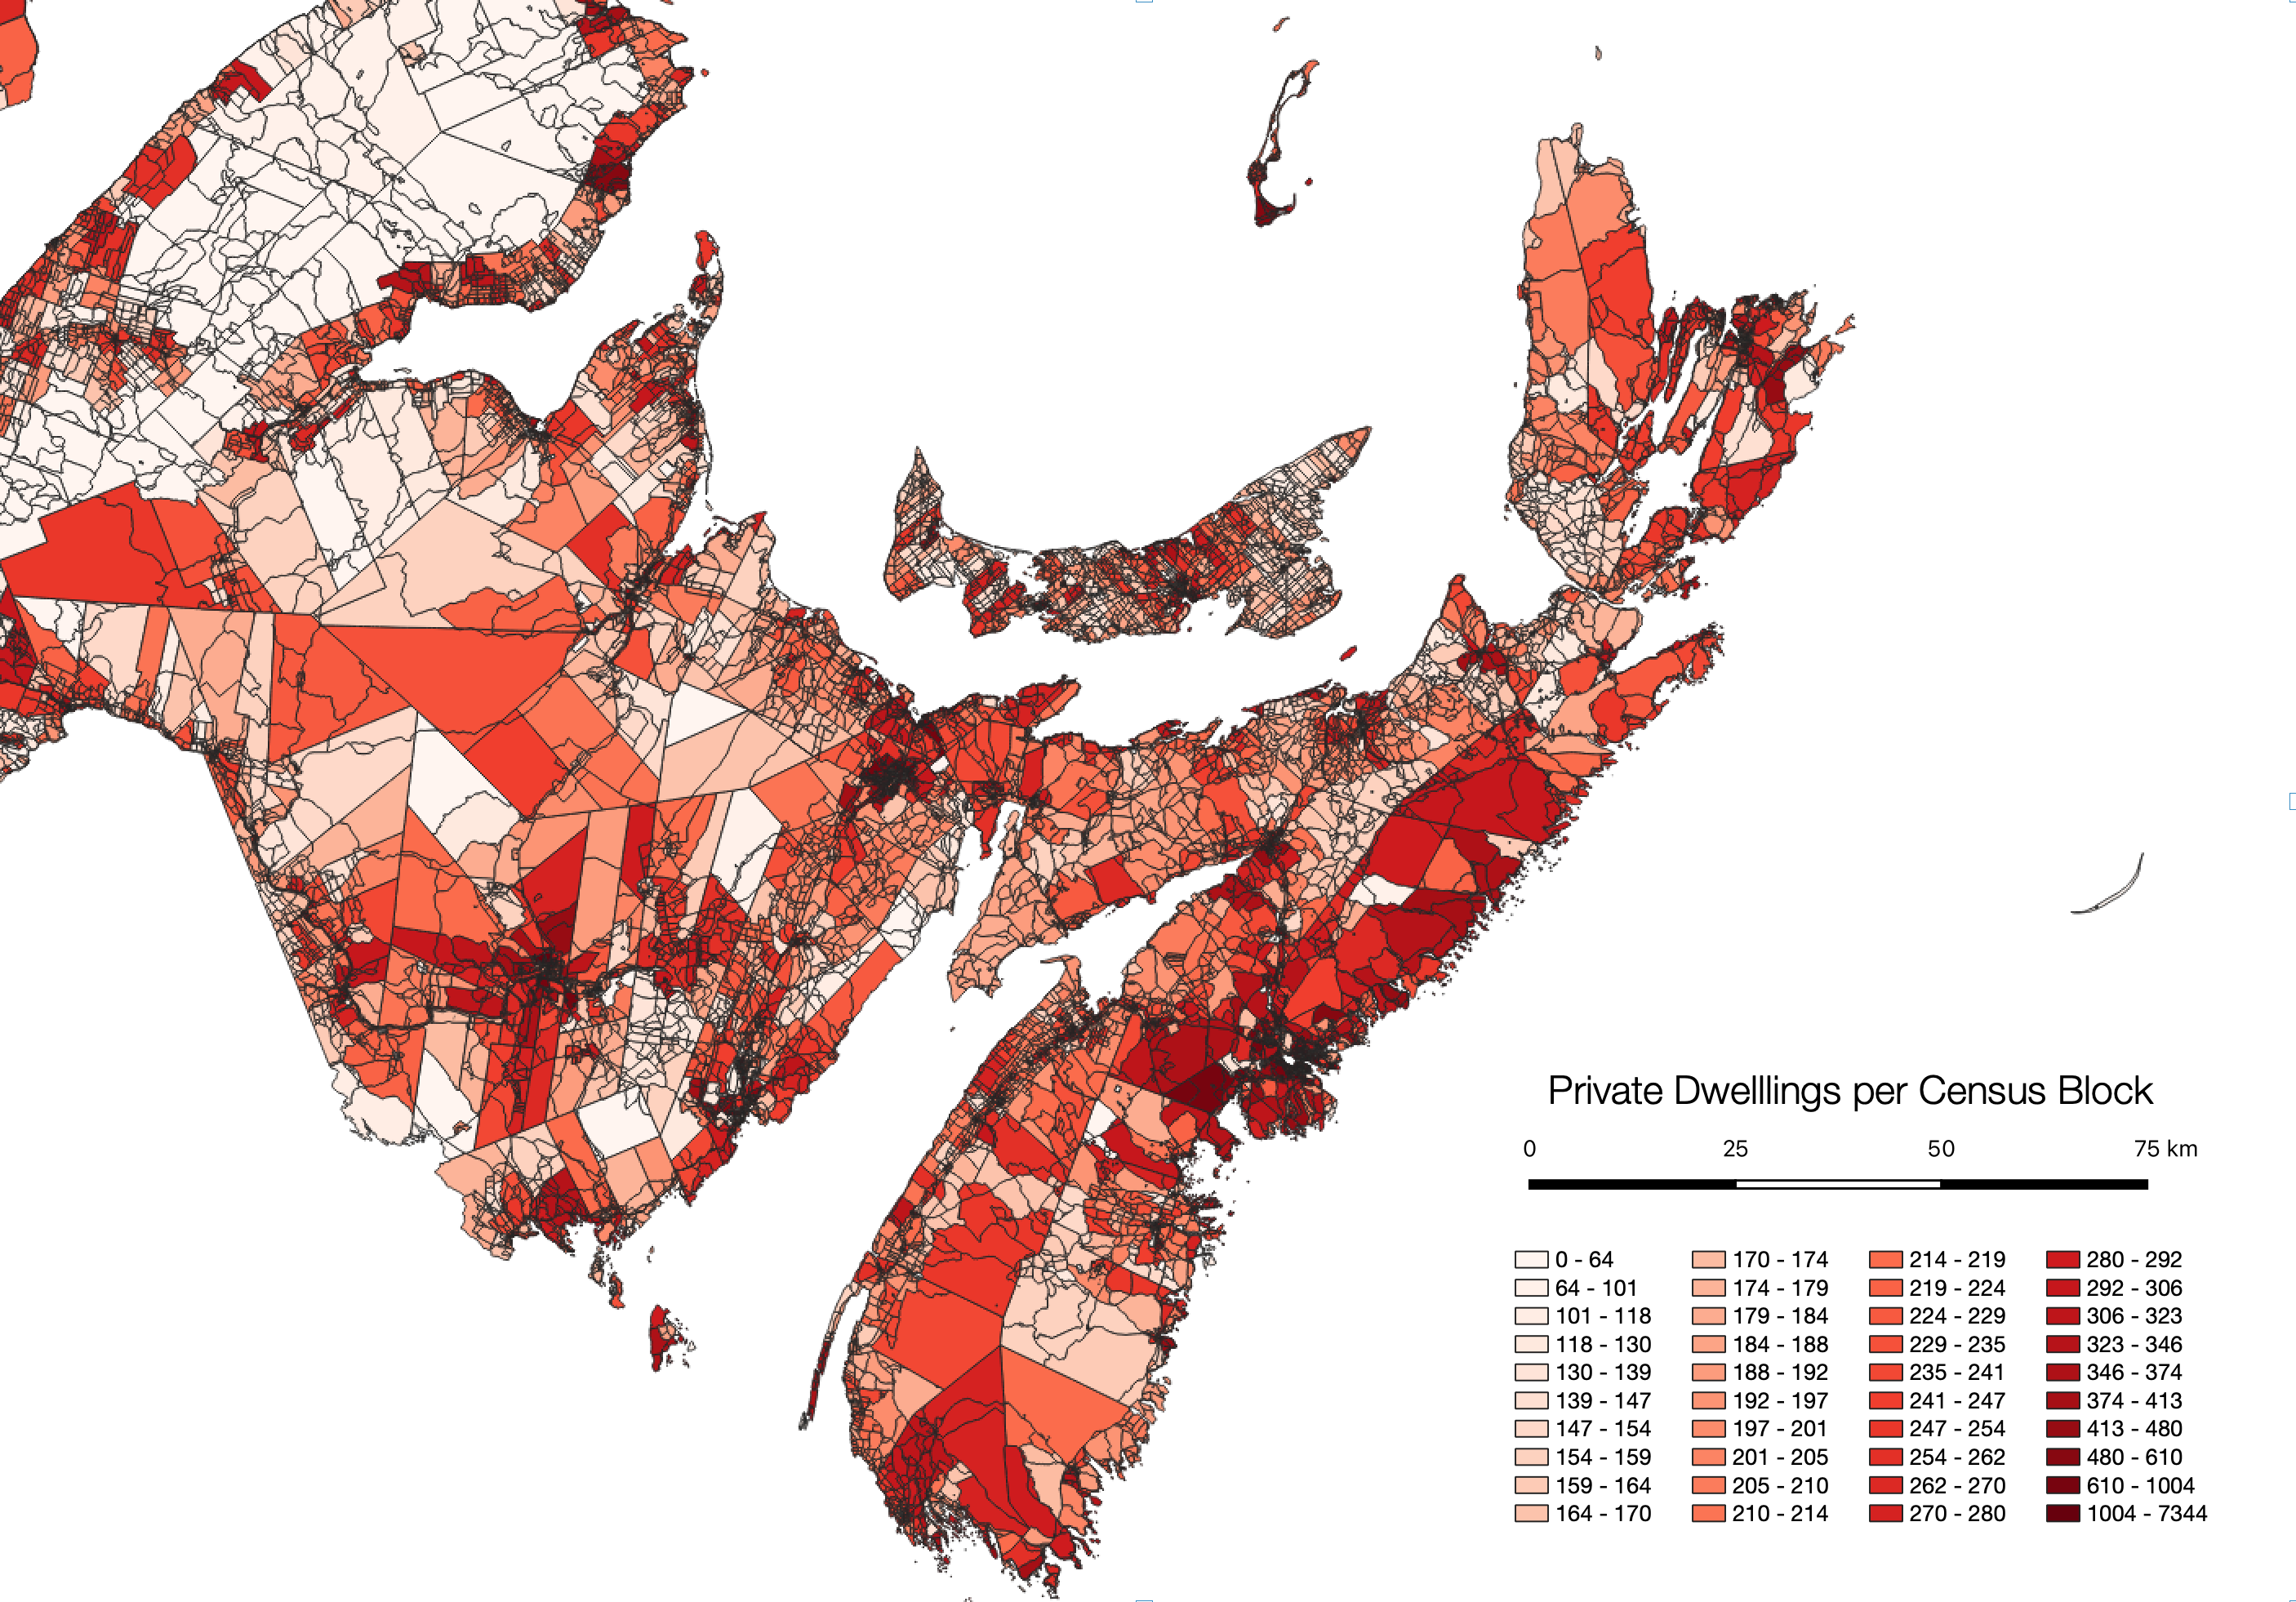
Day 26 – Choropleth
Mapping 2016 census, dwellings per census block in Atlantic Canada. I used the Population and Dwelling table joined to the dissemination area shapefile.
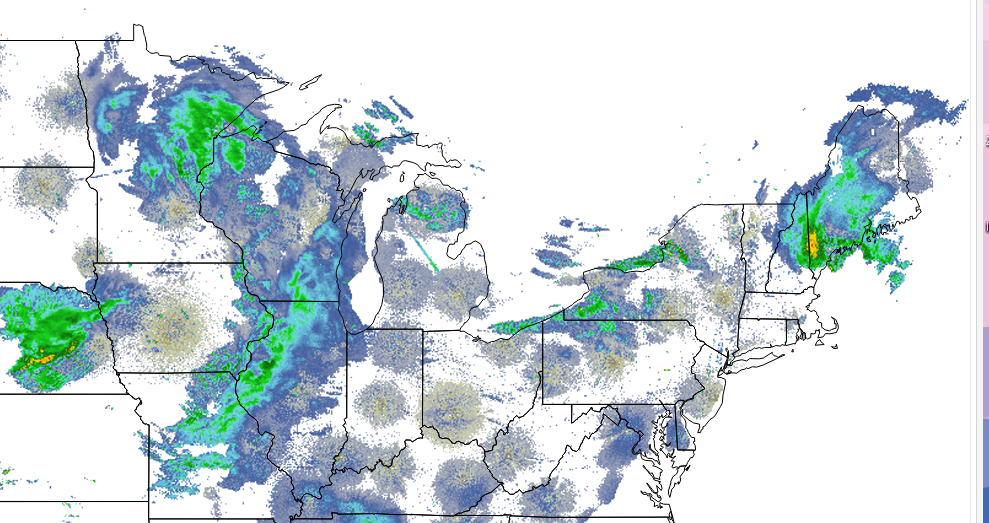
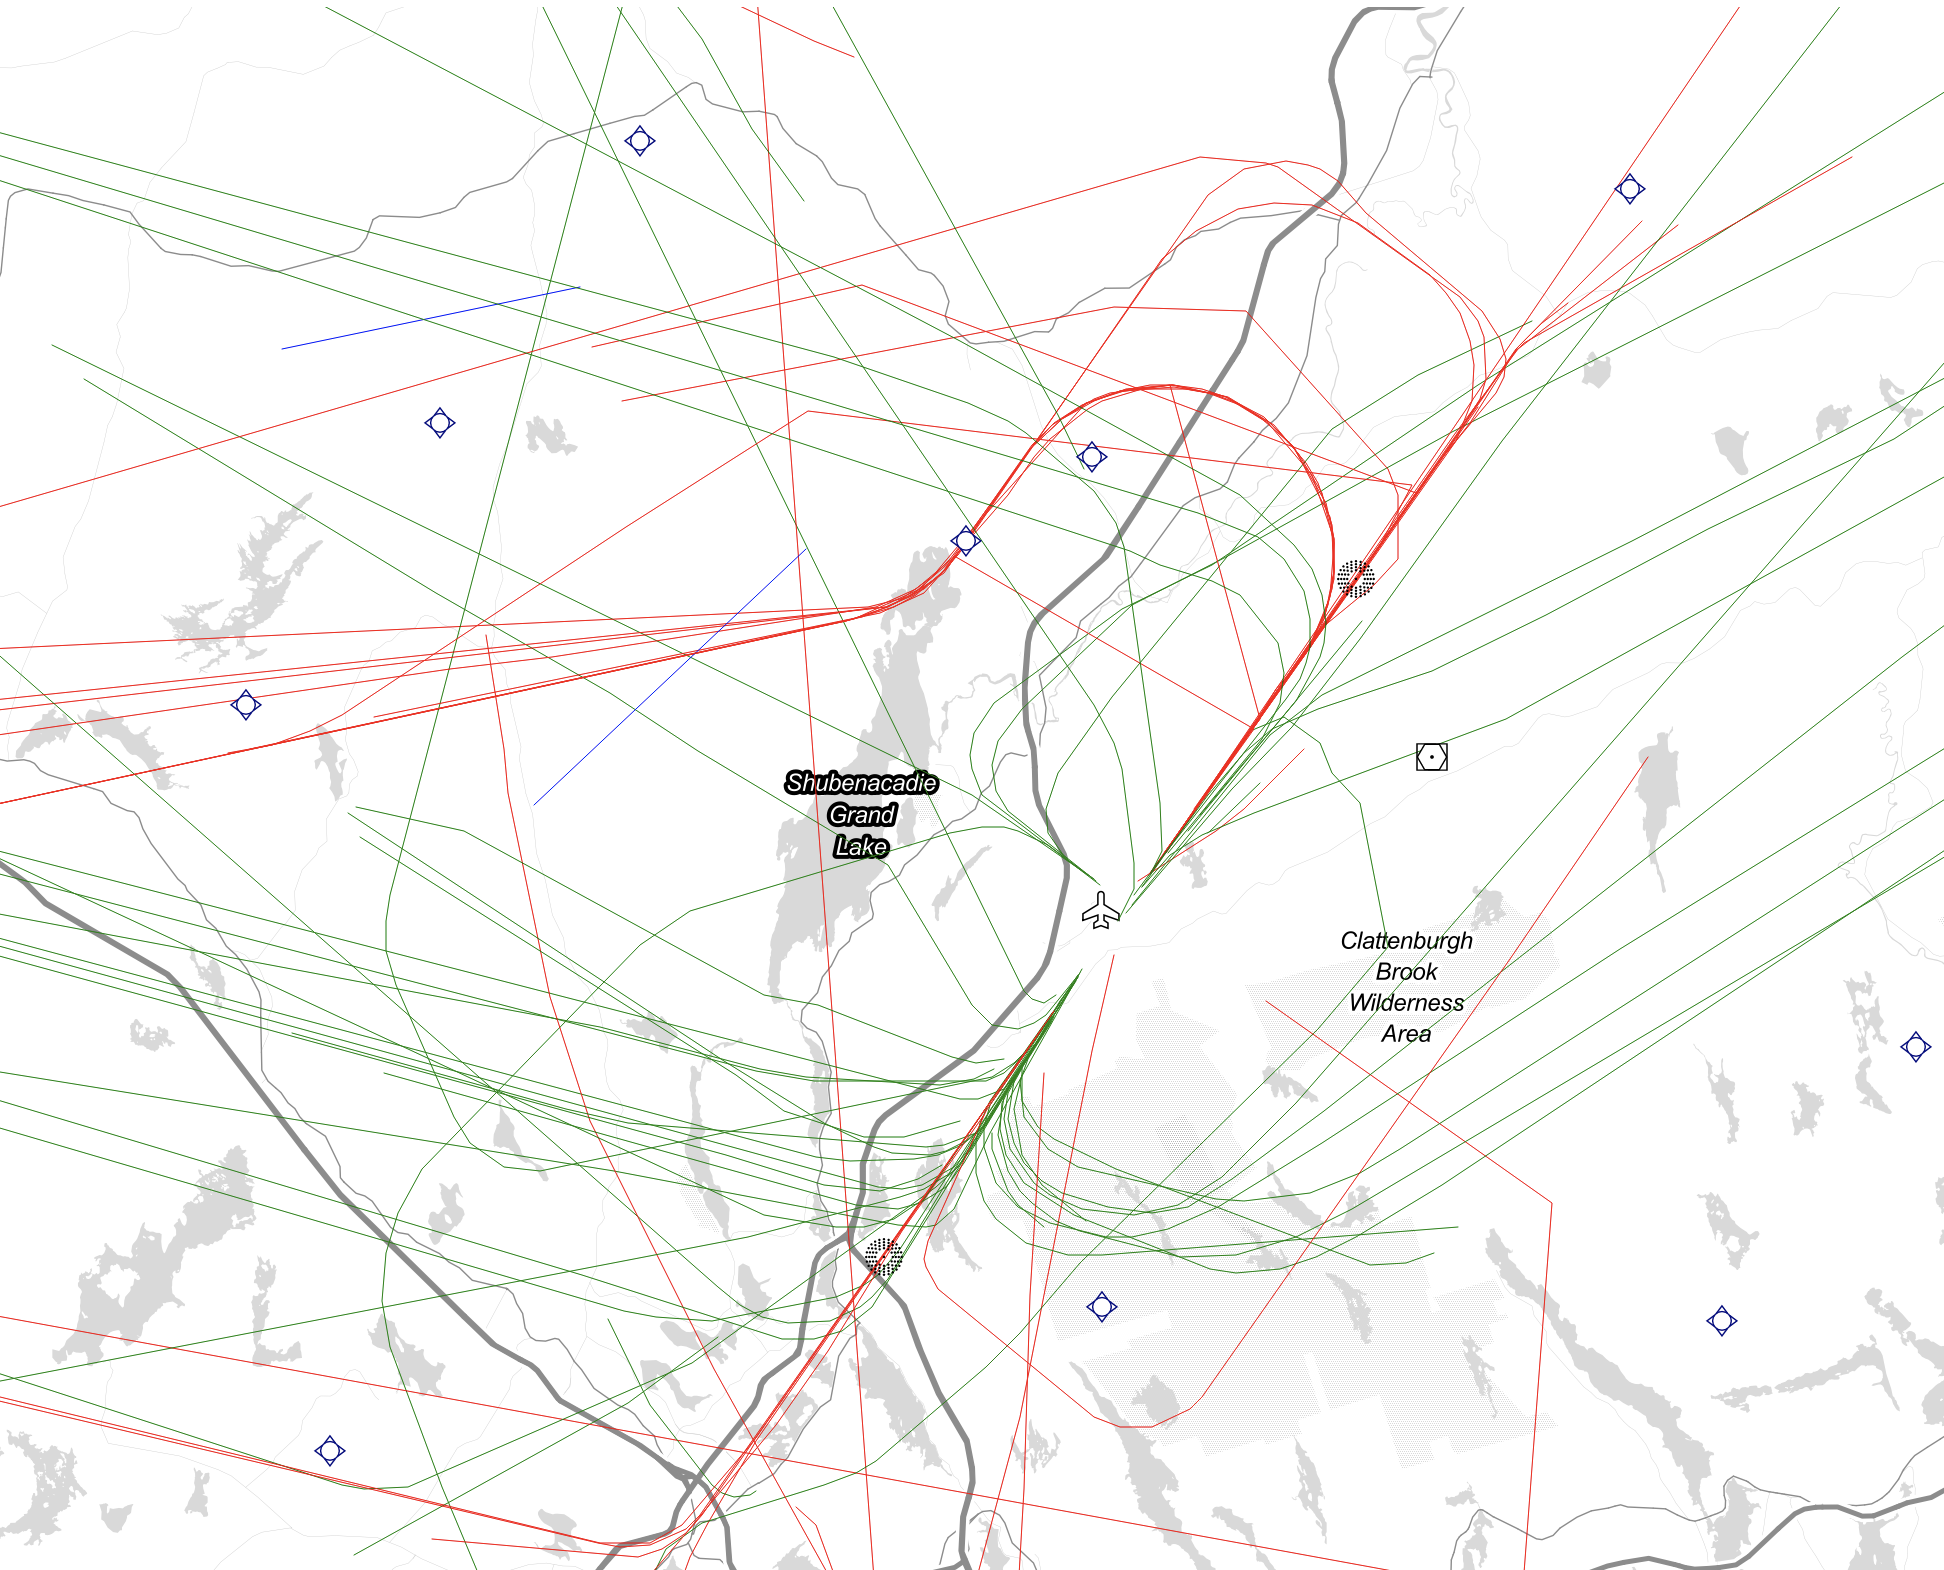
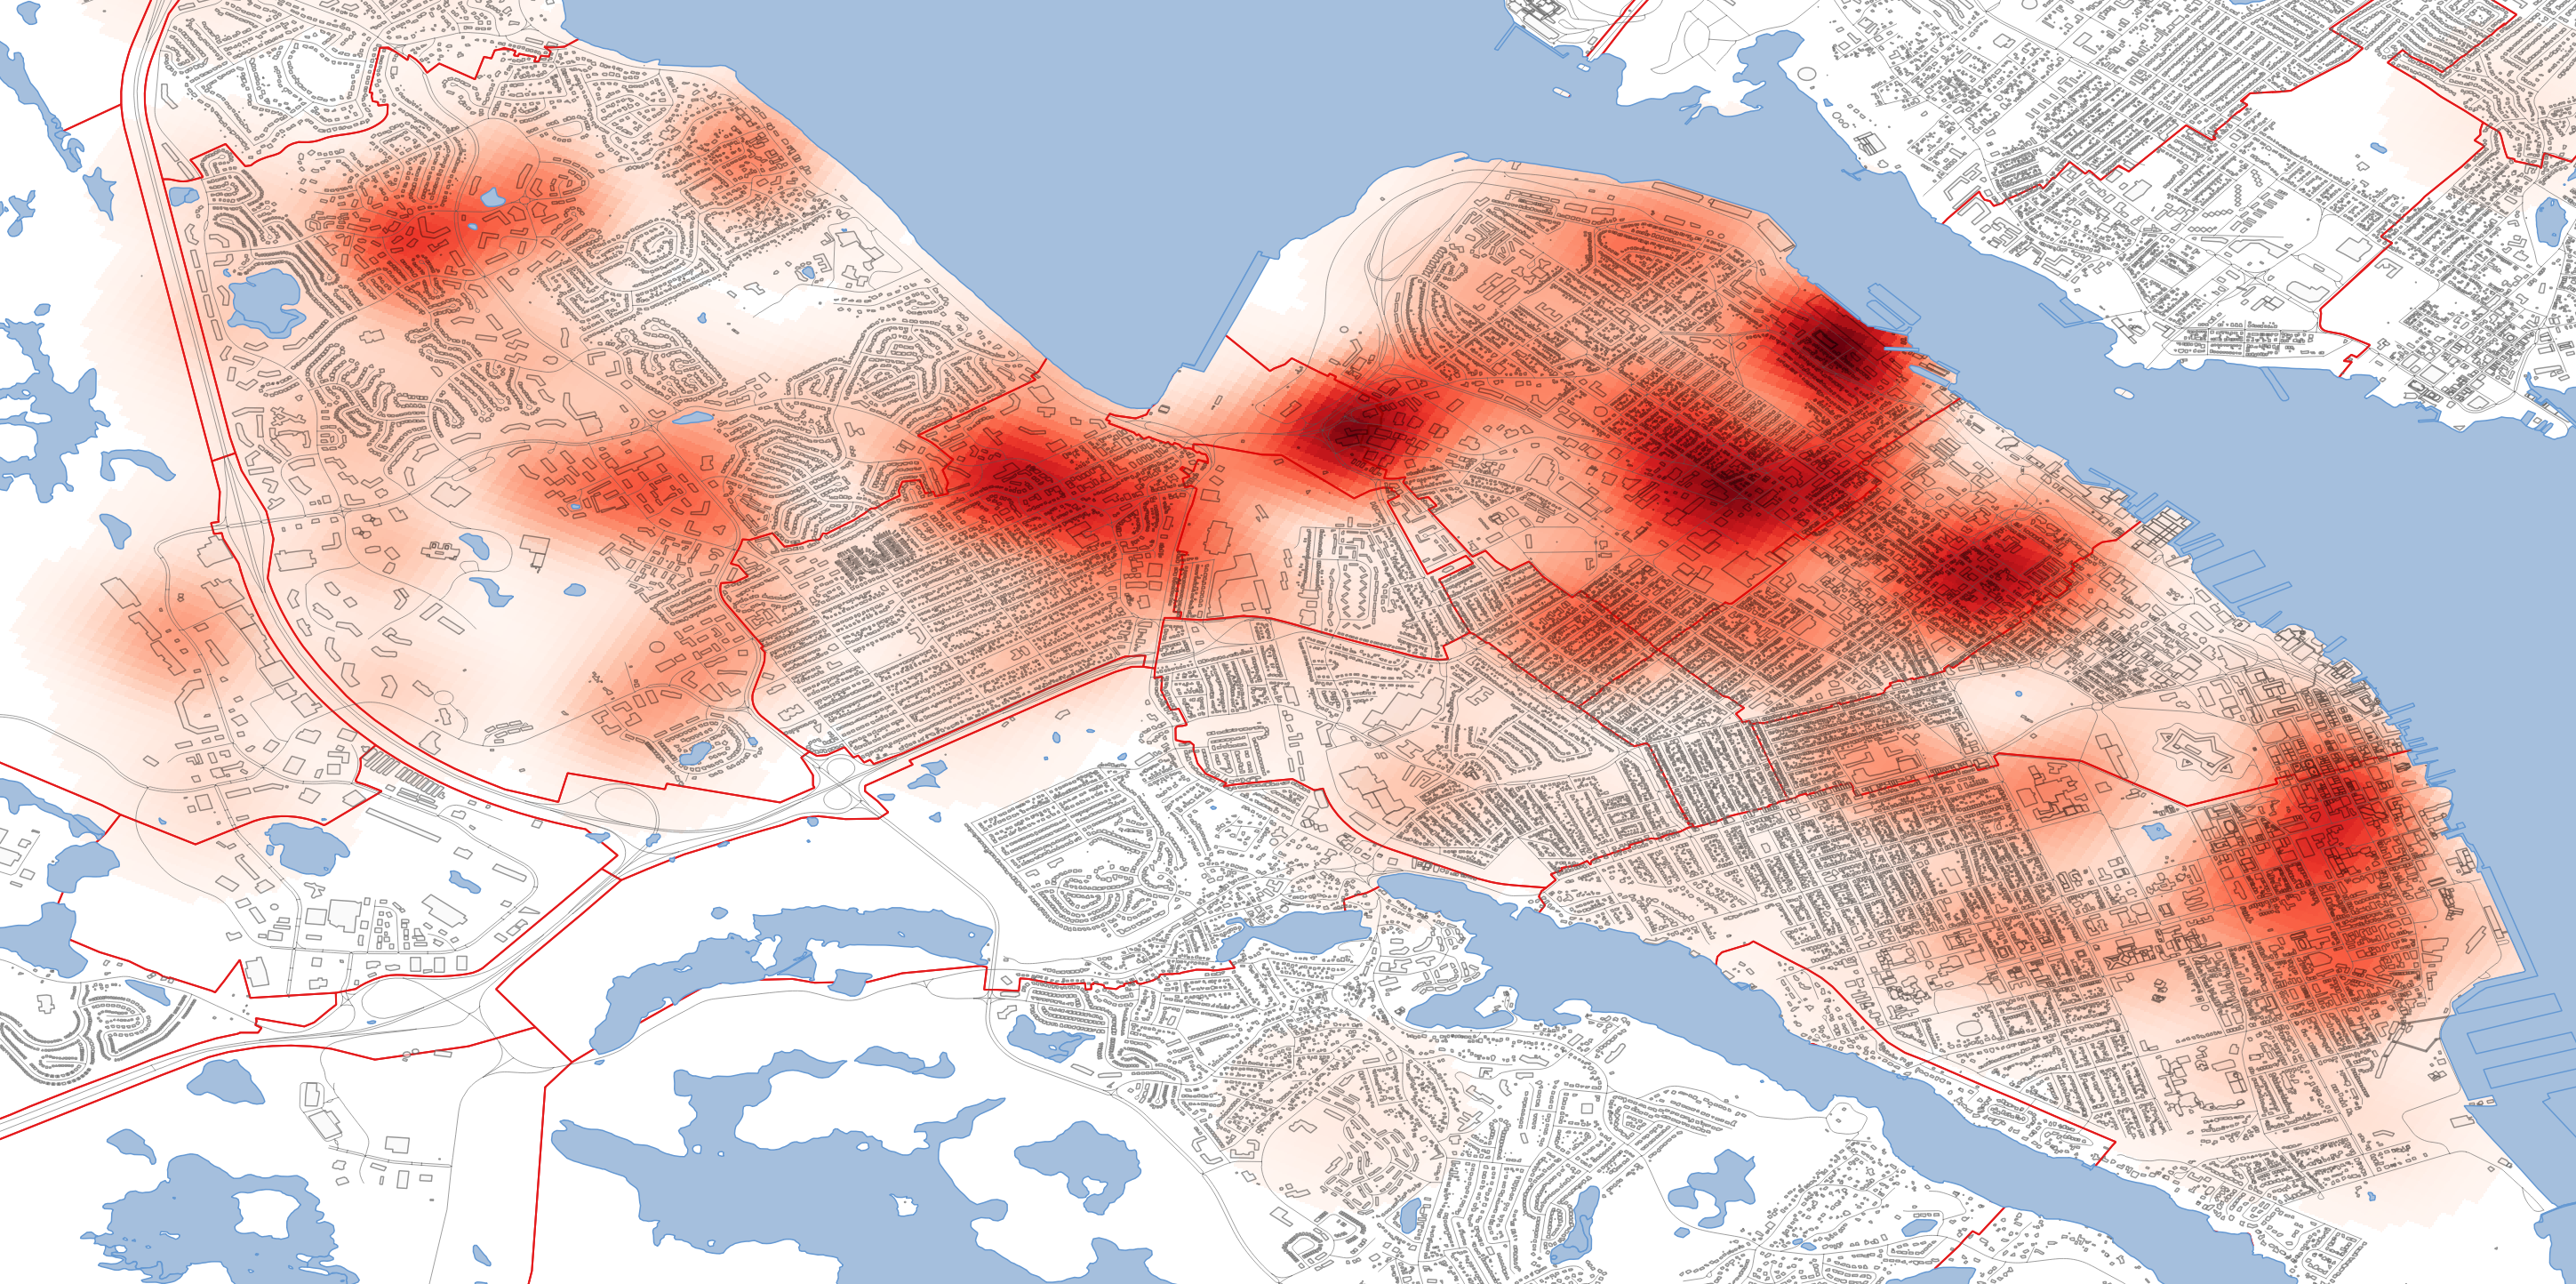
Day 27 – Heatmap
this map hows the density of station responses from January – July 2020. there were 460 source points to generate this heat map.

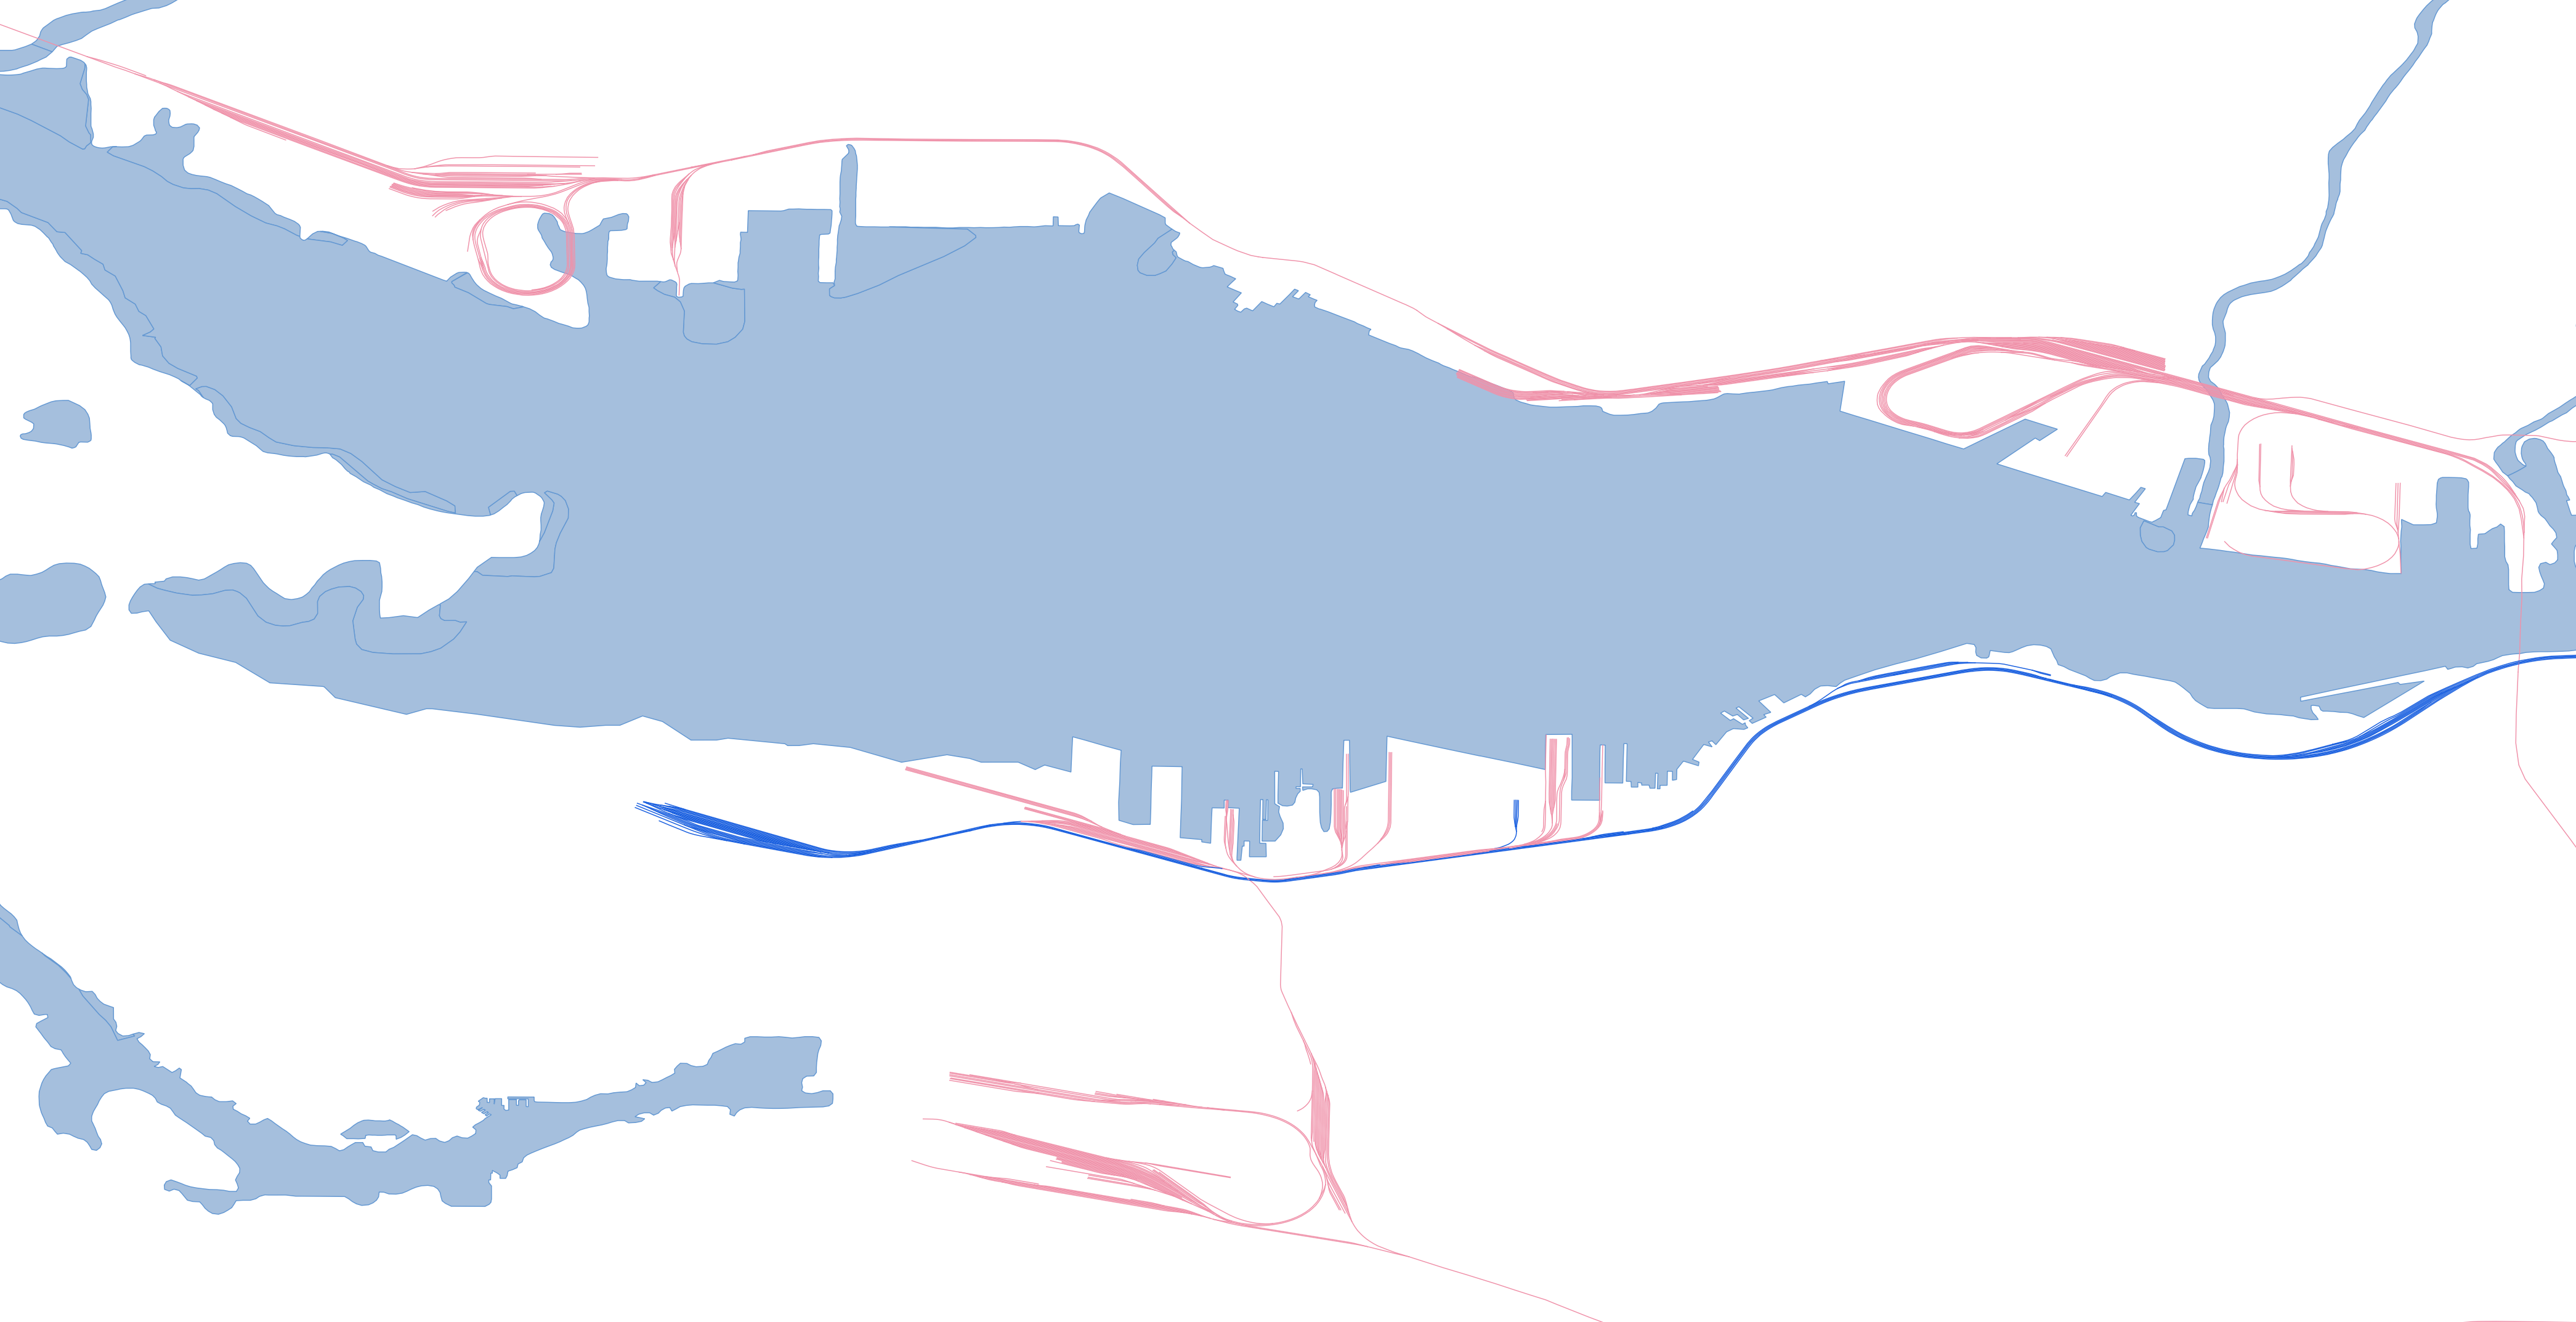
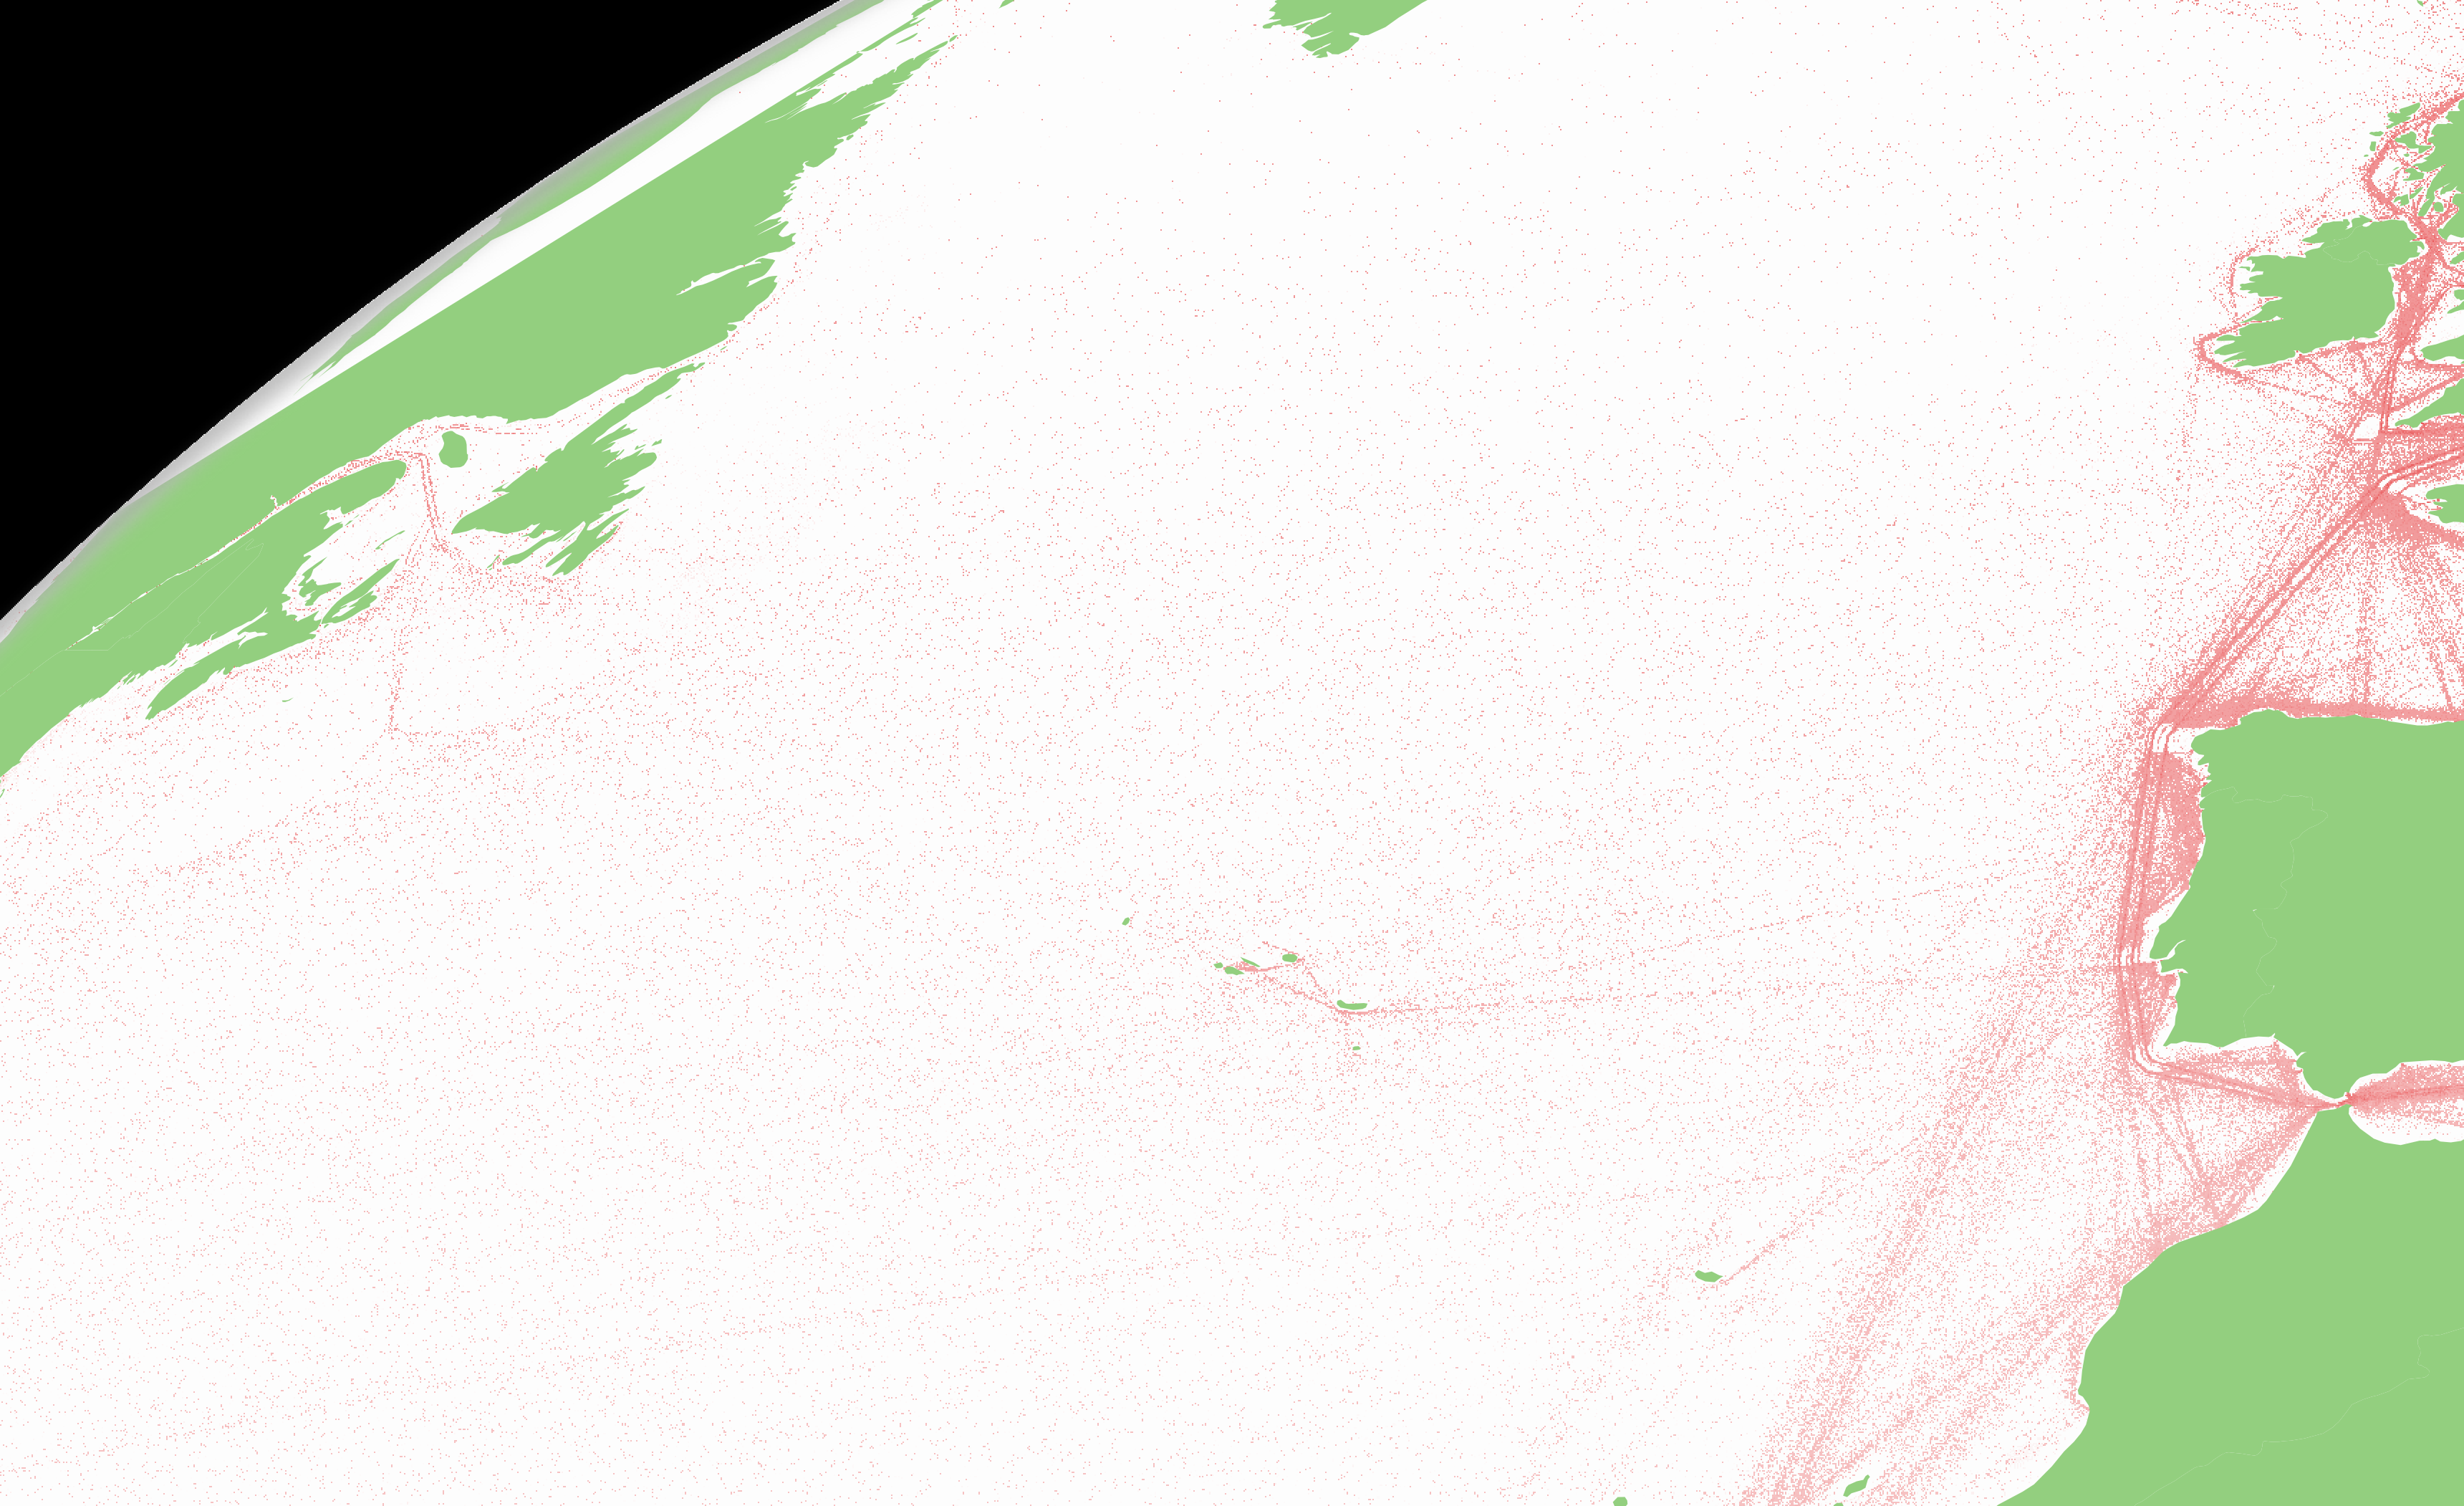
Day 28 – The Earth is not Flat
Global shipping density displayed on a globe. You can see the Great circle route from the Mediterranean to the Panama Canal decently well. Ship Density Data is from the world bank, and the globe was done with a QGIS plugin

Day 29 – Null
For Null, i mapped Abandoned Mine openings in Pictou County. Holes are null, abandoned things are null, so abandoned holes are double Null. Of note, looking at the provinces data, there were 2 Tungsten mines in Lower Sackville, A gold mine in Fairview, and a Arsenic Mine in Waverly. Data Set from the Province of NS


Day 30 – MetaMapping day
Meta data is data about data, therefore a Meta Map is a map about maps. That is the purpose of this post. to organize the 30 days, and guide you through it.

30 Day Map Challenge – pt 2

This is the second post covering days 11-20 of the 30 Day Map Challenge. The first 10 days were previously posted. As a reminder, these are the themes

Day 11 – 3D
this is Sable Islands Bald dune from the north beach (looking east). The landcover is derived from 30m resolution landsat data using NDVI. ground is NS DEM, with generated Hillshade and contours.

Day 12 – Population
since the 2021 census data doesnt come out until the 17th, for day 12 i was forced to use 2016 data. I used the Population and Dwelling table joined to the dissemination area shapefile. you can really tell the suburban areas with high-rise development.

Day 13 – Natural Earth
the challenge for this map was to use data from natural earth. This map depicts the time zones of Atlantic Canada, and everything you see here was done with Natural Earth data.

Day 14 – Map with a new tool
I used tableau to tutorial a weather map based on a turtorial i found online. Tableau is annoying.

Day 15 – Map without a computer
Halifax harbour, free hand on paper

Day 16 – Urban/Rural
for this map I show the urban and rural firefighting water supplies. Each red dot represents a fire hydrant. Outside the dotted areas, firefighters are using a dry hydrant, or drawing directly from a body of water. Data is from Halifax Open Data Portal. Hydrant Dataset, Dry Hydrant dataset, fire response zones dataset

Day 17 – Land
The full island map from Day 11. Same Data, and everthing, just in a normal map view.

Day 18 – Water
A rough approximation of CHS Chart 4203 Pt.Pleasant to Black Point. Constructed with CHS NONNA 10m data. Navigational Markers were built from the List of Lights, Buoys and Fog signals publication. A how to was posted previously.

Day 19 – Island(s)
Georges island. Custom POI layer, otherwise 1m DEM and water polygons.

Day 20 – Movement
for day 20, i animated the points of ship movements in the harbour on Nov 14. Some of the Ferries are noticeably missing – They Carry a Class B AIS receiver, which uses a different data format, and so i dropped it. (A Bigger version also can be had here)

BBC Europe

The General Cargo Vessel BBC Europe took to the anchorage yesterday on Arrival. the ship features 2 250 ton cranes, with a combined lifting capacity of 500 tons.

The ship has some unidentified cargo on its deck. It sailed from South Korea in September, and made stops in Florida Georgia and North Carolina, after passing through the Panama Canal.

30 Day Map Challenge

Over on Twitter i have been participating in the #30DayMapChallenge. the challenge consists of 30 themes, with the idea to produce a map for each one. This post summarizes the challenge, and includes information on the data sets used. A full explanation of the themes can be found on github.

Common Data Sources
these are some common data sets that I frequently come back to.
HRM Building Outlines – polygons representing building footprints
HRM Street Centerlines – centerlines of streets, with names
HRM Active travelways – sidewalks, paths and trails
HRM Lidar DEM 1m – 1m resolution lidar data from 2017.
Canadian Boundaries – Canada land forms and provinces.

Day 1 – Points
the First 3 days of the challenge focus on the 3 kinds of Vector GIS Data, Points, Lines and Polygons. Points maps marine occurrences since 1975 reported to the Transportation safety board, and maintained within its MARSIS database. Bathemtry is from GEBCO

Day 2 – Lines
Lines come from the Canvec National Railway Network, and depict CN and CP rail lines around Vancouver harbour.

Day 3 – Polygons
i used a collection of data from Halifax Open data to extract the building footprints form the heritage property data set. Also used are the cities 5m contour, road network, and parks and active travel ways data sets.

Day 4 – Hexagons
hexagons make a cool unit for showing density. the city has street tree point data available, so i mapped density of street trees per 50m hexagon.

Day 5 – Open Street Map
using leaflet.js, i apply aircraft tracks picked up from my adsb receiver to an open street map basemap. The goal was to use OSM Data. done.

Day 6 – Red
2019 Election results showing a strong liberal win. Data from elections Canada, Results merged with federal electoral districts

Day 7 – Green
National Parks in Atlantic Canada. I used the Official Parks Canada Greens for this map, and their Helvetica Neue font as well. Parks data came from the Canadian Protected and Conserved Areas Database (CPCAD). hillshade is extracted from Gebco.

Day 8 – Blue
with a blue theme, i chose to map Blue Mountain Birch cove lakes protected area. The city owns the land highlighted in purple, but the goal is fill in in the park. there are advanced discussions underway for the area to receive national urban park status.

Day 9 – Monochrome.
This map was made with the Province of Nova Scotia’s Digital Terrain Model data, and Roads, Trails, and Rails overlayed. it gives a nice texture to the province, showing both the form of the land, but also human settlement. Both datasets are available via GeoNova

Day 10 – Raster
using the cities 1m lidar DEM, i extracted Point Pleasant park using the cities park shape file. the 1m resolution lets you clearly see paths through the park, and the remains of the old military installations.

My Trip to Sable Island (Pt1)

Earlier this month a spent a week on Sable Island. I volunteered to assist with the construction of some fencing as part of a research project being undertaken by Parks Canada and the Sable island Institute. While i was on the Island i tweeted various photos and observations. This series of posts will rehash alot of that content, and hopefully provide some more context to it.

Sable island is located about 150nm off the Nova Scotia coast. it is made entirely of sand deposited by the leading edge of a glacier when it receded during the last ice age. There are no rocks on the island, but there is fresh water. Due to its position, the island is often windy, but even in winter seldom drops below -5C. My week on the island featured uncharacteristically good weather, with sun most days and temps in the high teens and low twenties. (there were some rain showers one afternoon, and we did have a day with 40knot winds)

The island is largely vegetated, with a combination of grasses and heath. There are introduced plants – Cranberry, roses, and a lone sad pine tree.

Aerial View of sable island, Main Station at the top Right, West light in the centre.

Currently you can visit sable island. the island is only open for day visits, and thee is no public accommodation on the island, and camping is not permitted. To Fly, Sable Aviation, Vision Air, and Breton Aviation all offer flights. Our ride to the island was via Vision Air’s S-76a. We landed at the main station helipad

vision air’s S-76A

Sable Aviation provided are ride home. They operate a Britten-Normander Islander Aircraft, and use the beach near main station as a runway. wind had blown loose sand drifts across the landing area which is why the helicopter was needed.

Main Station is the hub of habitation on the island. It was originally maintained by the Meteorological Service of Canada, but was taken over by parks Canada in 2013.

the long building is the Garage/maintenance shop/and generator building. There is also the Staff House (now known is the VQ, or Visitors Quarters), and the OIC House. the two distant buildings are the hydrogen building, used by MSC to launch weather balloons, and MSC’s lab. the dome contained instruments to track the balloons.

ex MSC Facilities, hydrogen shed, and lab building.

(above)Staff House (Below) my room. In non covid times, the house can sleep around 20 people. there are a couple of rooms outfitted for single use, others meant to be shared. due to covid, it was one to a room. there is a Large Kitchen, and a lounge space.

The front sunroom area was reserved for day use visitors.

Transportation on the island was primarily via Jeep Rubicon with balloon tires. Gators, a Polaris, and ATV’s were also in use. (the drive belt on the Polaris broke, and we needed to tow it back to main station.)

one last thing about sable. being a relatively flat bit of land in the middle of the ocean, tsunamis are a concern. Main Station features two 7 person lifeboats should a large wave be detected heading towards the island.

ZIM Kingston on Fire off Victoria

The 4253TEU container ship ZIM Kingston is currently on fire, while at anchor at Constance Bank, off Victoria BC. The ship had sailed from Busan, South Korea for Vancouver.

On Friday Oct 22 the ship reported loosing 40 containers in 20′ seas just after midnight. the ship was 43 miles west of the entrance to the straight of Juan de Fuca when the containers were lost. The ship did some odd manoeuvring where the containers were lost.

ZIM Kingston then proceeded to anchorage in Constance bank. From photos it looks like lost containers are from two stacks, one forward and aft. Several of the lost containers were later spotted by USCG Aircrews, and noted to be moving north. A gale warning is in effect, with winds of 20 knots, increasing to 40 Monday.

On Saturday morning around 11am, the ship reported that damaged containers were on fire.

CGCS Photo via Twitter. Crews can be seen fighting the fire with two hose streams.

The crew was advised my MCTS to abandon ship. 10 members were removed by the coast guard and taken to Ogden Point. after a small explosion, an additional 6 crew were removed.

As of Saturday Night, 16 crew had been evacuated from the ship by CCGS Cape Calvert and CCGS Cape Naden, with 5 including the captain remain on board. The CCGS reported 10 containers were on fire. 2 of which are self combustible (Class 4.2) potassium amylxanthate — which is used in the mining industry.

The ships owner had contracted salvagers, and Maersk Tender and Maersk Trader have responded. these ships were in the area, and normally operate ocean cleanup equipment to remove plastics from the water.

Seaspan Raven has also on scene since Saturday. Due to the the chemicals on fire reactivity to water, water is being used to cool the surrounding areas of the ship but not directly attack the fire.

CCGS Via Twitter

As of this morning, the Atlantic Raven, which is under contract as an emergency towing vessel for the coastguard is on scene, and the fire is reportedly still burning.

Additional Updates as they become Available.

UPDATE: there is currently a news conference on Now. The fire is reported to be out, but there is alot of heat and smouldering. crews will attempt to extinguish the fire onboard the ship tommorow.

Related Posts Plugin for WordPress, Blogger...