I recently tweeted this map of the Tantalon fire burn scar, and offered up a post on how its made, if there was interest. There was, so here we go.
Sentinel-2 is an earth observation satellite (there are actually 2 in orbit) operated by the ESA. It offers 10m resolution (meaning each pixel is 10m on the ground), and passes over any given location every 5 days. 10m resolution is not super clear, but it is useful for looking at changes to the earth – like deforestation, Infilling of waterways, or tracking large fires.
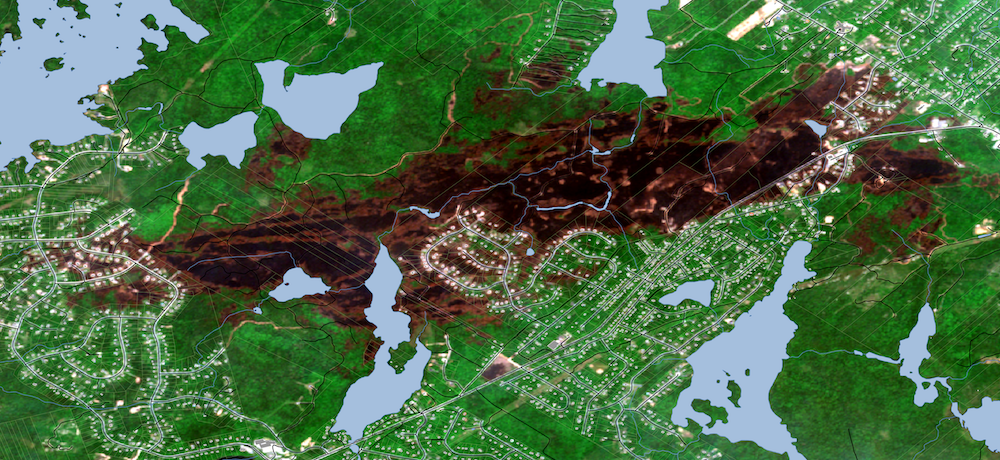
The June 12th pass was the first over the Tantalon area with clear skies.
From the Sentinel Hub site, you can download imagery that is georeferenced. (Free Trial Account required)
(Above) Satellite Photo from Sentinel Hub.
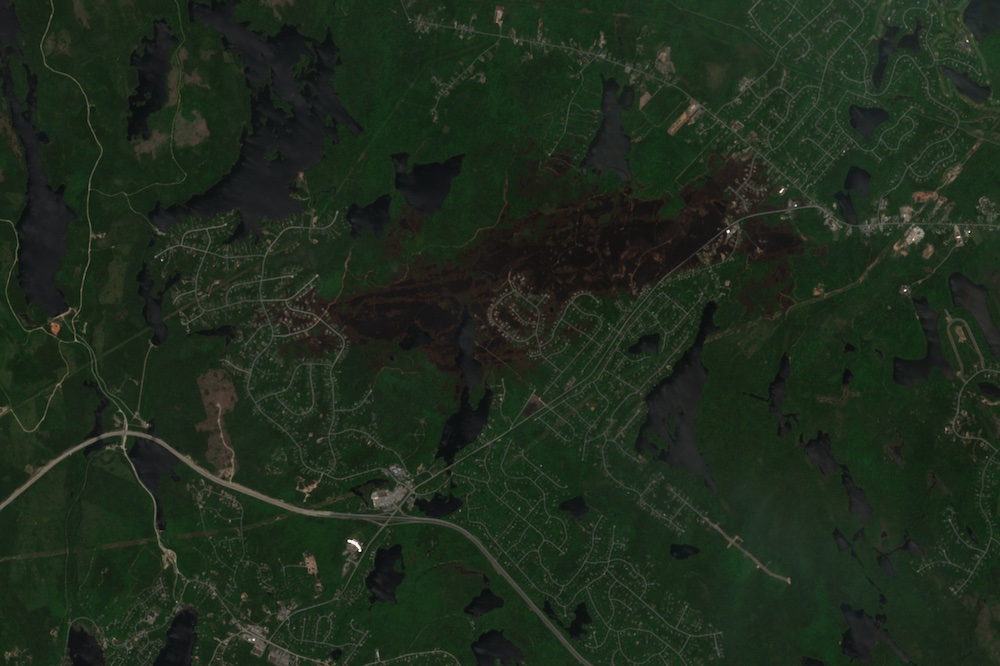
Once we have the photo, we can add other data to it in QGIS. I’m not going to go into adding and styling layers in QGIS, But you can see the layers getting added in the video below. (For more GIS How to, see How to produce a Nautical Chart and making the map)
These are the Open Data data sets I used, clicking the link takes you to the download.
UPDATE: I have posted a full process video from scratch on YouTube.
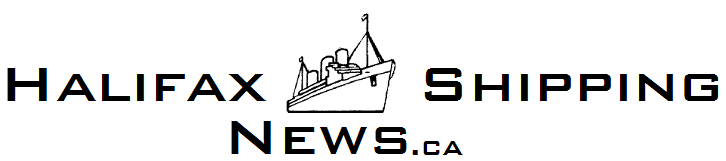
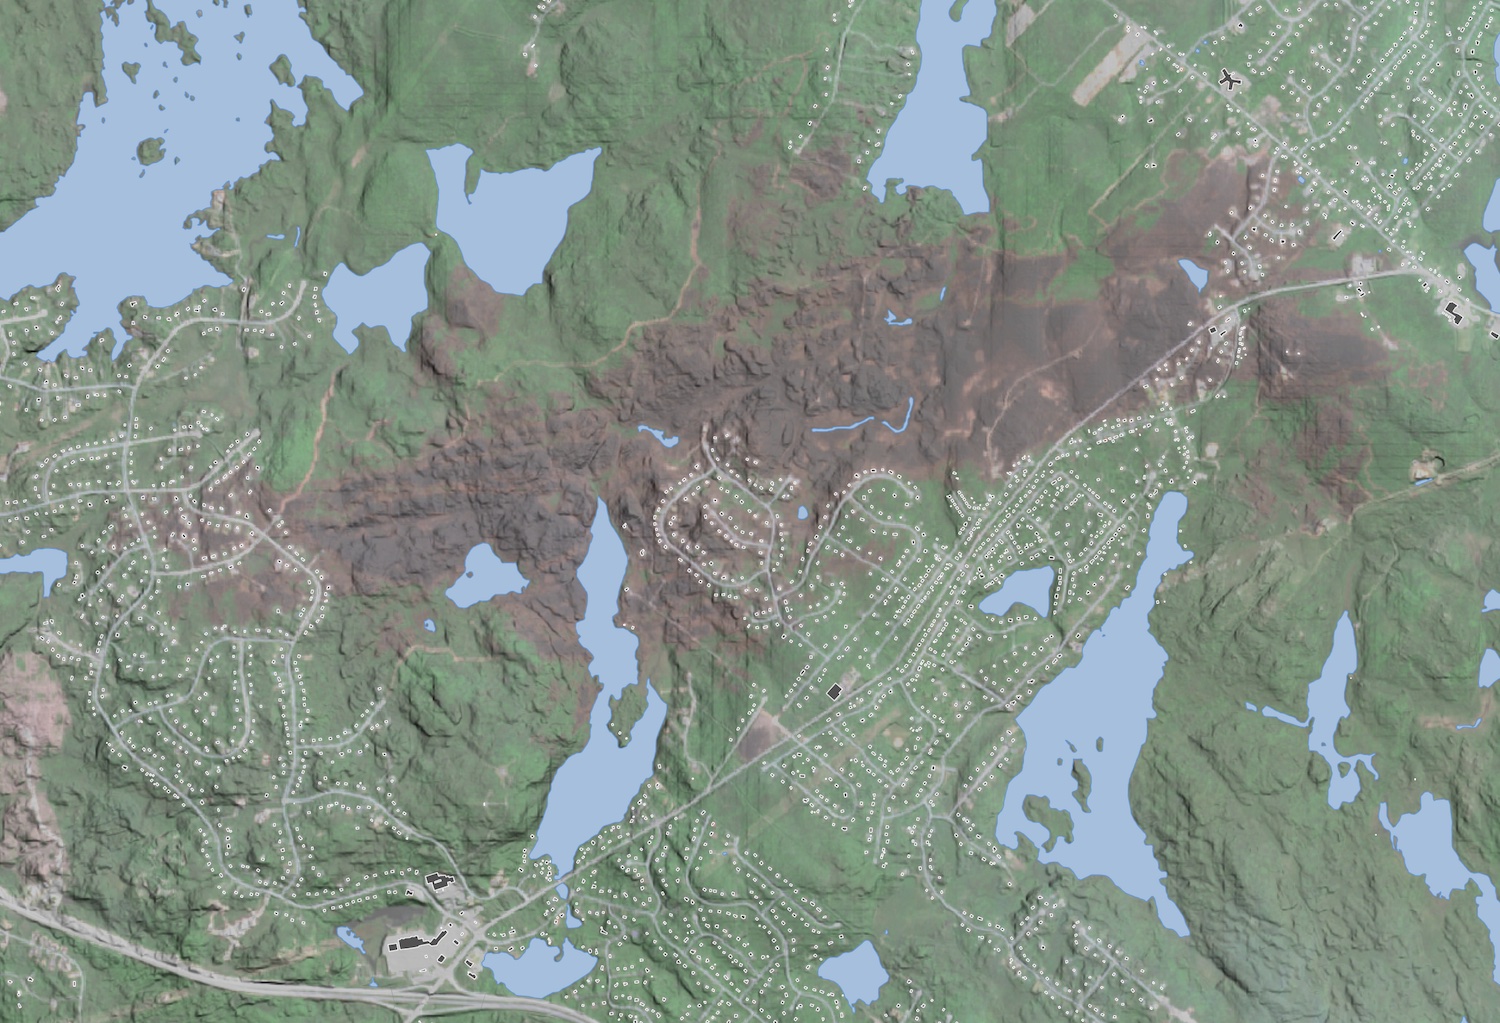
Also – New Version, draped over the HRM 1m DEM, transformed into a Multi direction Hillshade with a 2x vertical exaggeration, giving a good sense of the Terrain.
This is neat. Thank you. I enquired about a similar map but I’m in New Brunswick. There was a map of each seperate region showing burn scars from the past and it was color coded. I have seen this map before, more than once. I wish I could get it or see it again.
Take care from Miramichi.