
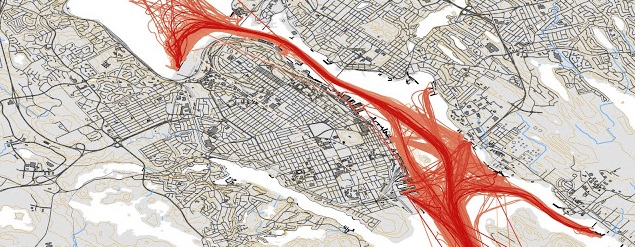
Recently I tweeted a map of 1 month of Halifax traffic from November 2011, and commented its due for an update. The latest data i have is from August 2016, so i Set out to Make the updated map. While Doing it, I also decided to Document how i did it.
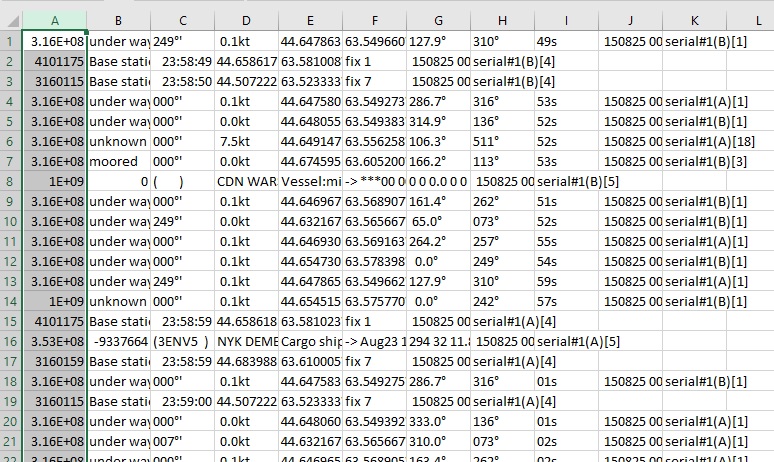
the first thing to do is grab the Log files from ShipPlotter. in my case the default location of C:\COAA\Shipplotter\logs was used. Below is a small Excerpt from one of the Logs. A Days data is about 15mb of Raw txt.
316004240;under way ;249°'; 0.1kt;44.647605N;63.549313W;288.3°;316°;56s; 150801 000000;serial#1(B)[1]
999999999;unknown ;000°'; 0.0kt;44.654905N;63.576475W; 0.0°;241°;55s; 150801 000001;serial#1(A)[1]
316015715;unknown ;000°'; 0.0kt;44.660408N;63.585980W; 70.8°;317°;57s; 150801 000002;serial#1(B)[18]
316009640;under way ;127°'; 0.1kt;44.647850N;63.549675W;121.4°;314°;58s; 150801 000003;serial#1(A)[3]
316012656;moored ;000°'; 0.0kt;44.680828N;63.610840W; 52.3°;225°;58s; 150801 000003;serial#1(A)[3]
004101175;Base station 2016-07-30;23:58:59;44.658570N;63.581072W;fix 1; 150801 000004;serial#1(A)[4]
003160159;Base station 2016-07-30;23:58:59;44.683988N;63.610005W;fix 7; 150801 000005;serial#1(A)[4]
003160115;Base station 2016-07-30;23:58:59;44.507222N;63.523333W;fix 7; 150801 000005;serial#1(A)[4]
316022239;under way ;000°'; 0.0kt;44.646912N;63.569125W;258.7°;255°;01s; 150801 000006;serial#1(A)[1]
316002800;under way ;000°'; 0.0kt;44.648033N;63.549392W;349.0°;136°;03s; 150801 000007;serial#1(A)[1]
316031831;unknown ;000°'; 0.0kt;44.675977N;63.611325W;304.1°;105°;04s; 150801 000008;serial#1(A)[1]
316009640;under way ;127°'; 0.1kt;44.647853N;63.549675W;121.4°;314°;04s; 150801 000009;serial#1(A)[3]
316014180;under way ;000°'; 0.0kt;44.654475N;63.562032W;249.2°;154°;05s; 150801 000009;serial#1(A)[1]
316013960;under way ;000°'; 0.1kt;44.632167N;63.565667W;324.0°;073°;02s; 150801 000009;serial#1(A)[1]
999999999;unknown ;000°'; 0.0kt;44.654905N;63.576473W; 0.0°;241°;04s; 150801 000010;serial#1(B)[1]
316004240;under way ;248°'; 0.2kt;44.647602N;63.549310W;296.5°;316°;06s; 150801 000010;serial#1(A)[1]
316009640;under way ;129°'; 0.1kt;44.647850N;63.549675W;121.4°;313°;06s; 150801 000011;serial#1(B)[3]
316022239;under way ;000°'; 0.1kt;44.646912N;63.569123W;256.5°;255°;10s; 150801 000014;serial#1(B)[1]
316006196;unknown ;000°'; 2.4kt;44.647903N;63.567170W;334.0°;511°;09s; 150801 000014;serial#1(B)[18]
004101175;Base station 2016-07-30;23:59:09;44.658567N;63.581068W;fix 1; 150801 000014;serial#1(B)[4]
I choose the month of august, as it was the most recent full month i had. in the folder with all the .log files, run a simple copy command to combine them all into one big file. Due to the Size, I combined 6 days of data into one file.
Copy *.log bigfile.txt
once combined, i use excel to grab the entries with a navigation status of “Under Way” I considered also collecting moored vessels, however just the underway vessels produced over 4 million lines of data in total. Once the csv file is open in Excel, I text to columned it, splitting on the semi colon. I then sort by by the Navigation status, and deleted all rows above and Below under way.
then i removed the excess columns, and saved back the csv.
after doing this with all 6 files, i combined them into one.
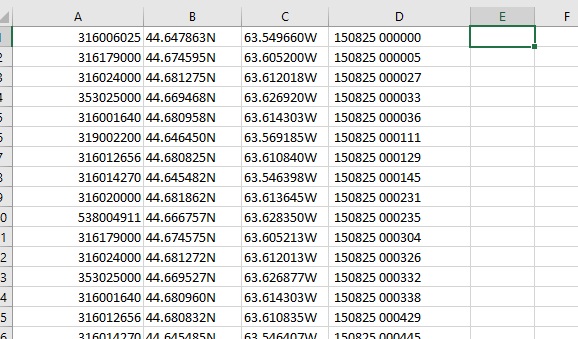
I then used notepad ++ to do a sanity check on my data – remove weirdness, and clean up the excess trialing comas. Once the underway data is collected, I combined the 5 files, and then added a Header row, to identify the MSMI, Lat, Long and the date. I am making this data available, and you can download it here: http://halifaxshippingnews.ca/AugPoints.csv (.csv 115mb) the data includes Lat/Long, Date/time and ships MMSI.
Once we have the points file, then we can move on to mapping it. – which didn’t work. oops. Need to get rid of the N, and W directional, and update to -63 to specify a west direction.
For this map, I grabbed QGIS – which is free, and created a layer from the XY Data. You basically get a Point Cloud.
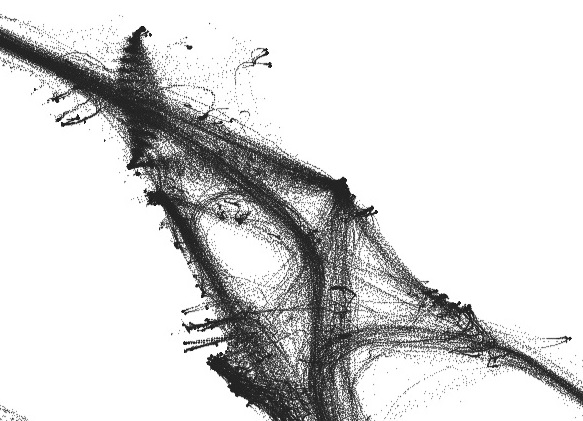 from there I ran the Points to Path tool, Which gave converted all the points to lines. I Set the layer to draw the lines really fine line weight, which gives the transparent look.
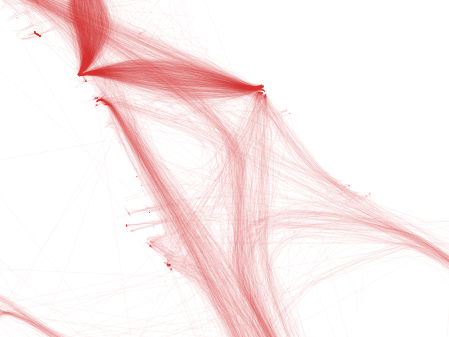 i also did some cleanup on the lines, deleting the tracks that had long straight lines crossing land.
The final Map used watercourse data from GeoNova,then the image was exported from QGIS. I then manually cleaned it up in Photoshop, removing the excess watercourses leaving only the shoreline. this is also where the labels and title block were added.
I should note the 2011 map was made in ArcMap. ESRI has made getting trial licenses a pain (And i have run out of email addresses) hence me turning to QGIS.
Pingback: One Month of Ship Traffic – Sept. 2020 traffic | Halifax Shipping News.ca
Pingback: Making the Burn Map | Halifax Shipping News.ca