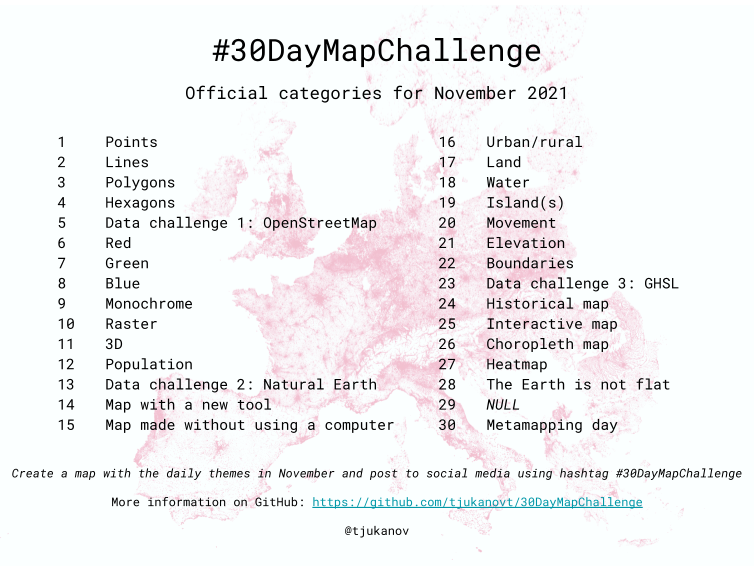
This is the Third post covering days 21-30 of the 30 Day Map Challenge. The first 10 days were previously posted and the Middle 10 days were as well. As a reminder, these are the themes
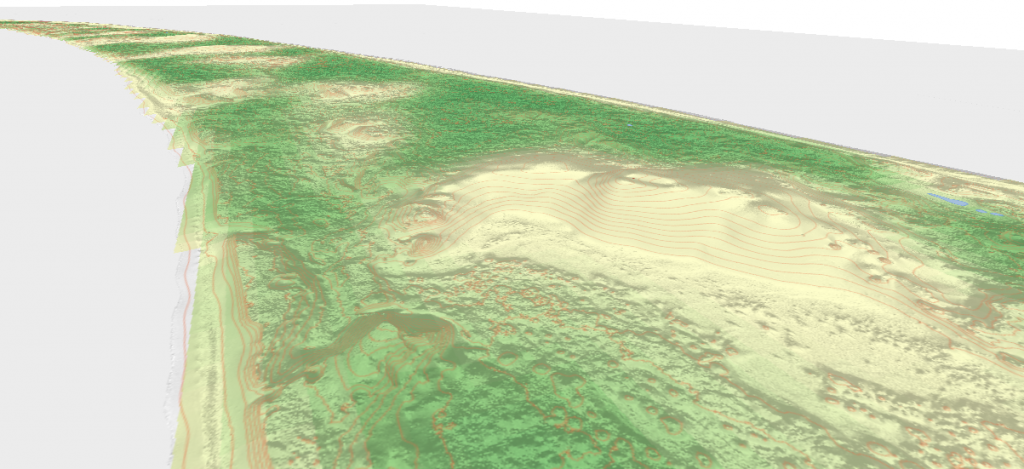
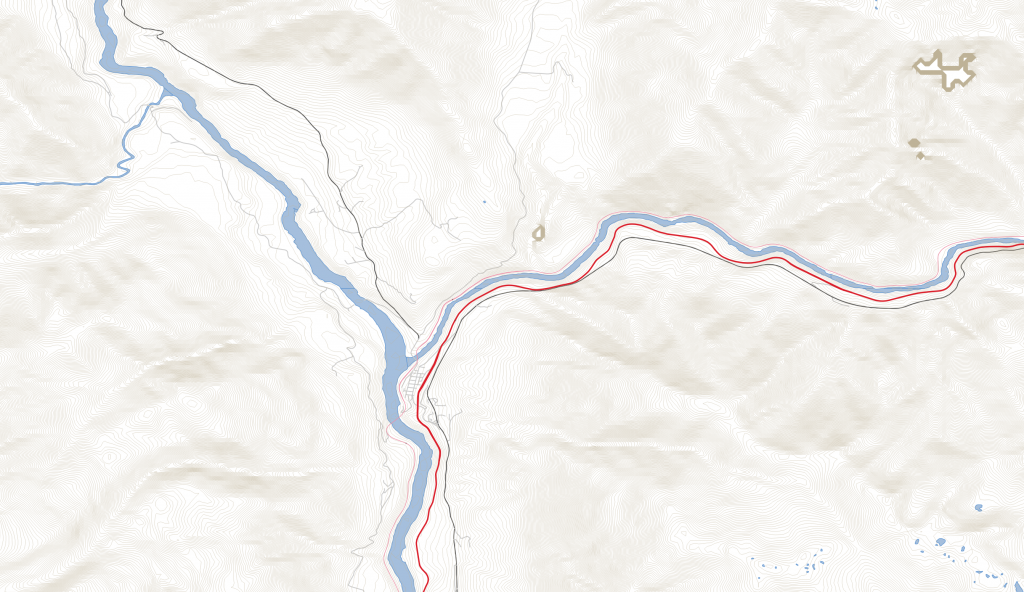
Day 21 – Elevation
Lytton BC, in the Frasier valley. This was generated with CANVEC Transport data, BC Water course Data, and the terrain is from SRTM.
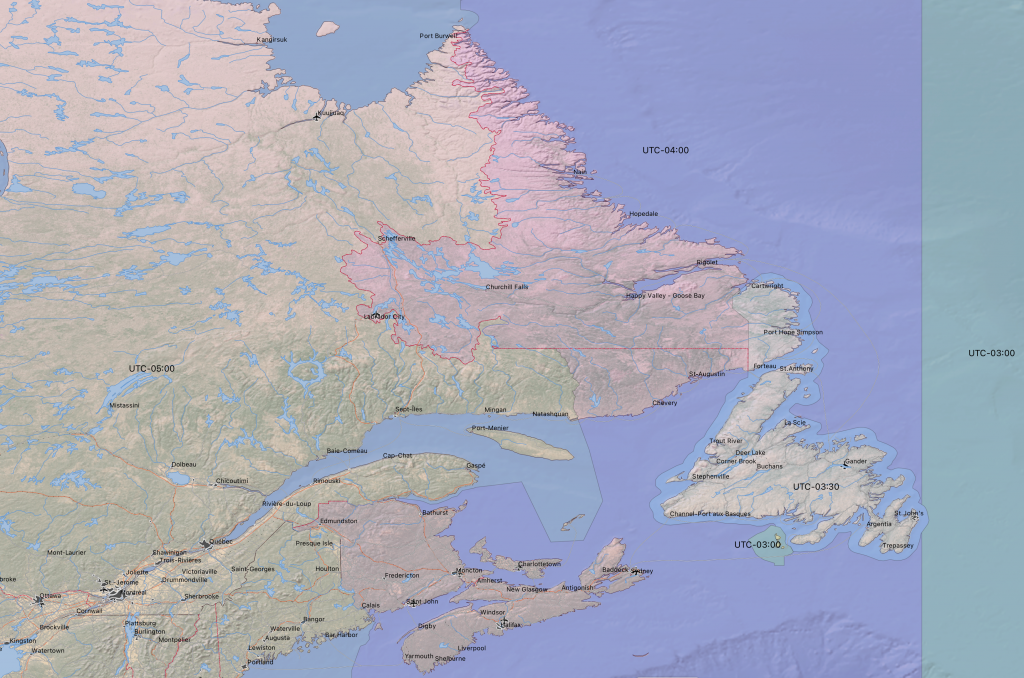
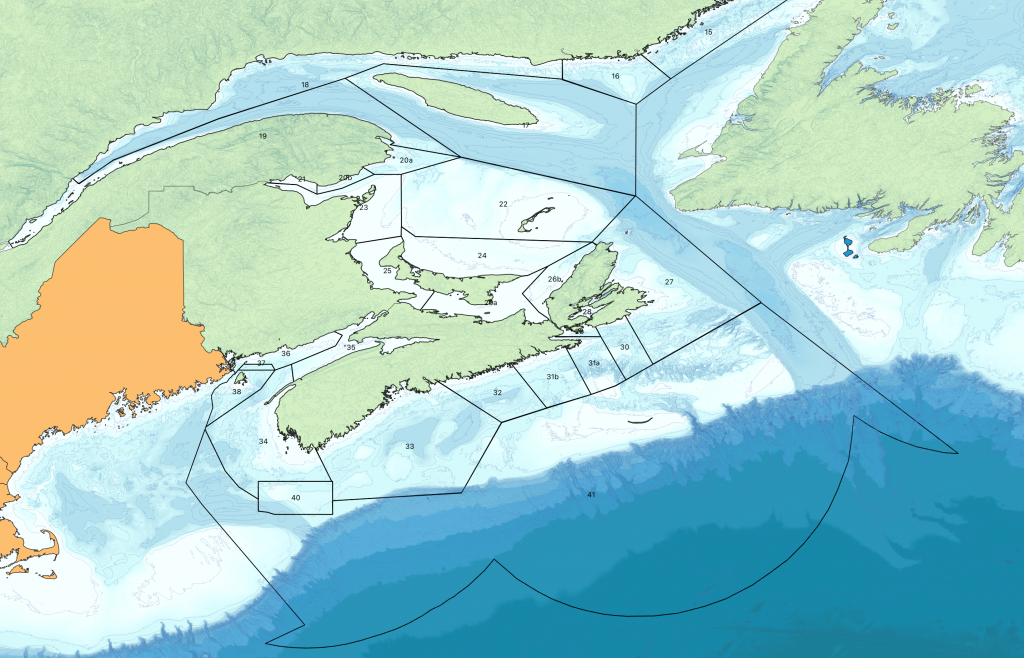
Day 22 – Boundaries
Atlantic Canada Lobster fishing areas. Each is defined in legislation, but there are no published shapefiles. Bathemetry is from Gebco.
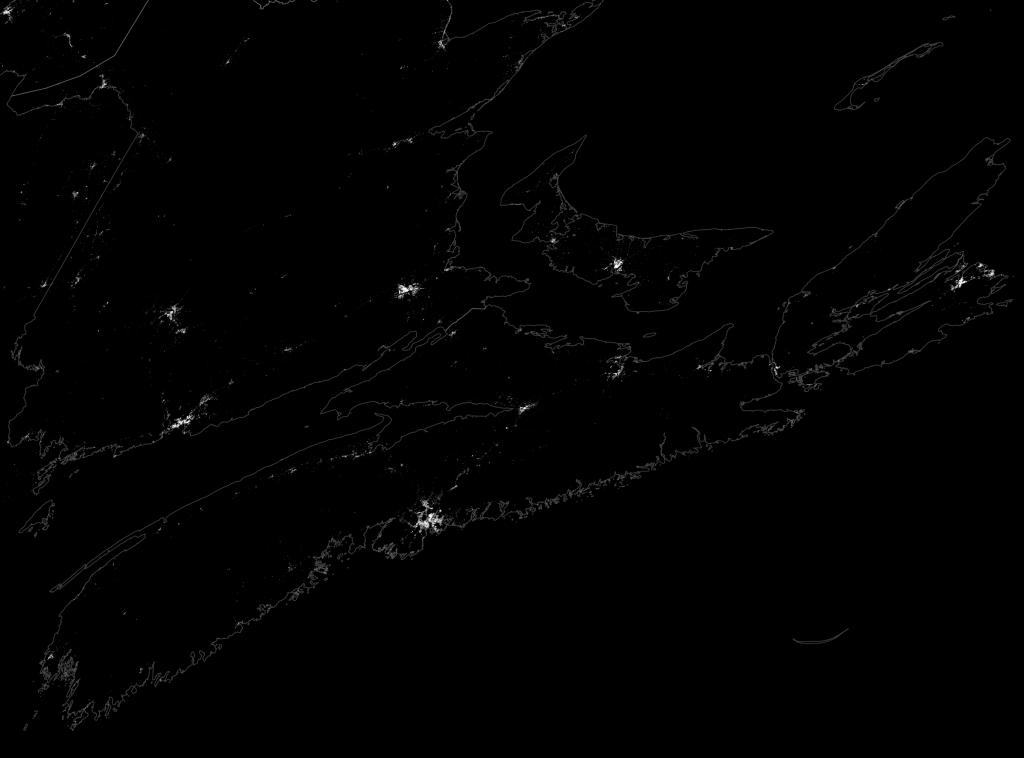
Day 23 – Global Human Settlement Layer
GHSL is a data set of where people live. I treated it as urban light at night.
Day 24 – Historical
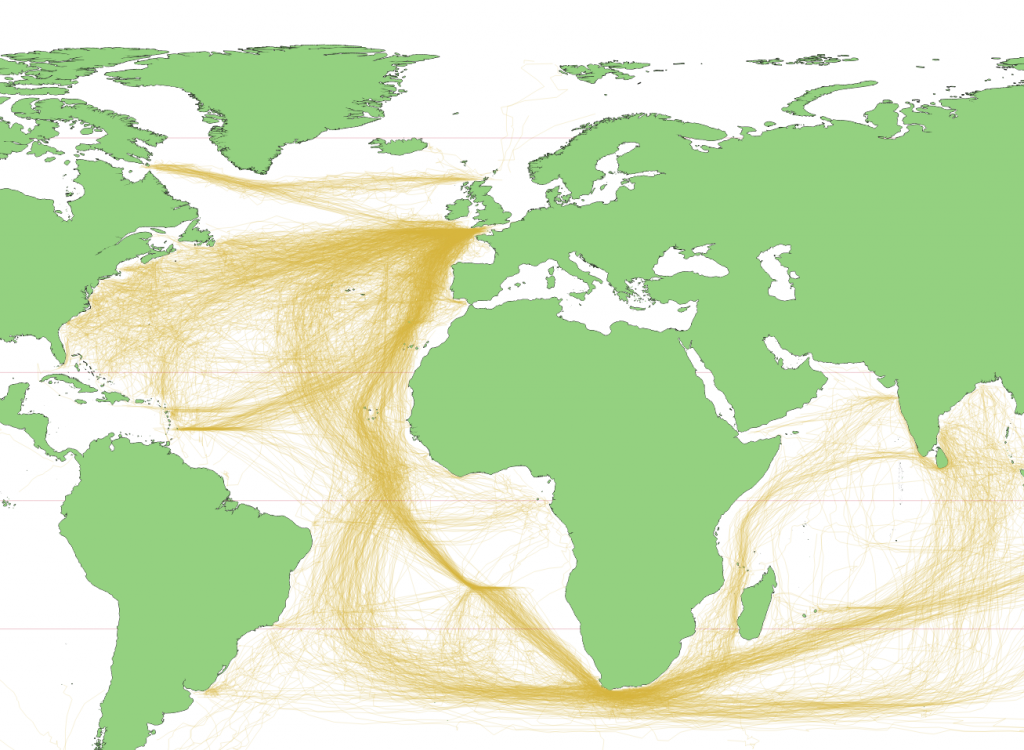
I made use of the CLIWOC dataset derived from ships logs to plot the main sea routes in use 1750-1850. These only show British ships, and you can see how the prevailing winds affected chosen routes, and the effects of the lack of a reliable way to determine longitude. the world data is from Natural Earth
Day 25 – Interactive
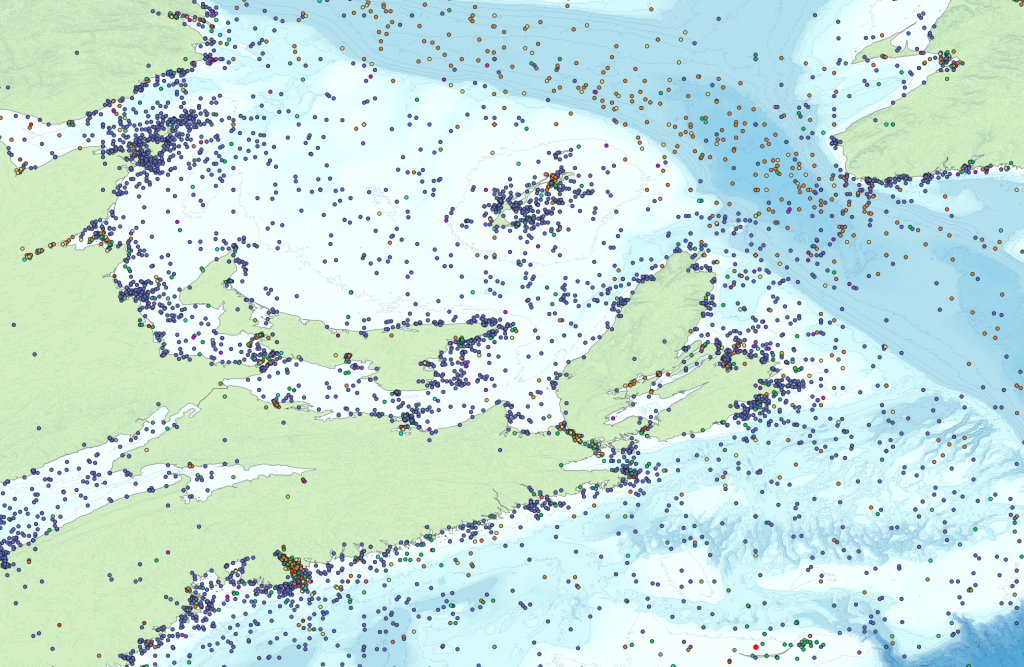
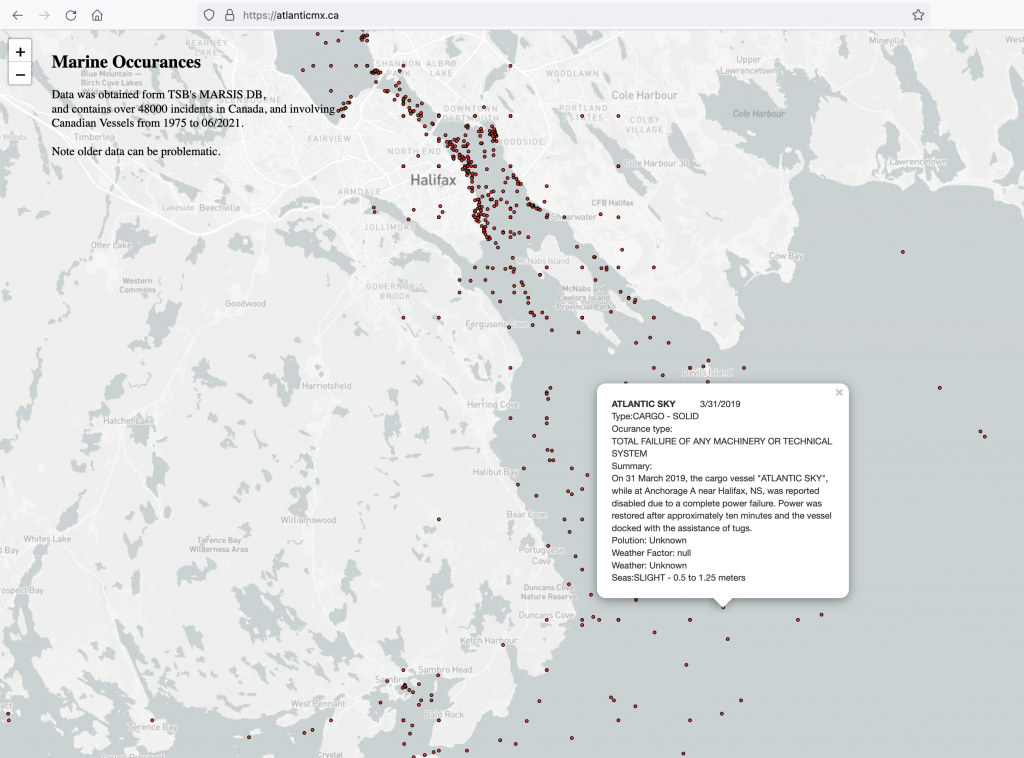
Day 1’s point map, but clickable and done in Leaflet.js. check it out at Atlanticmx.ca
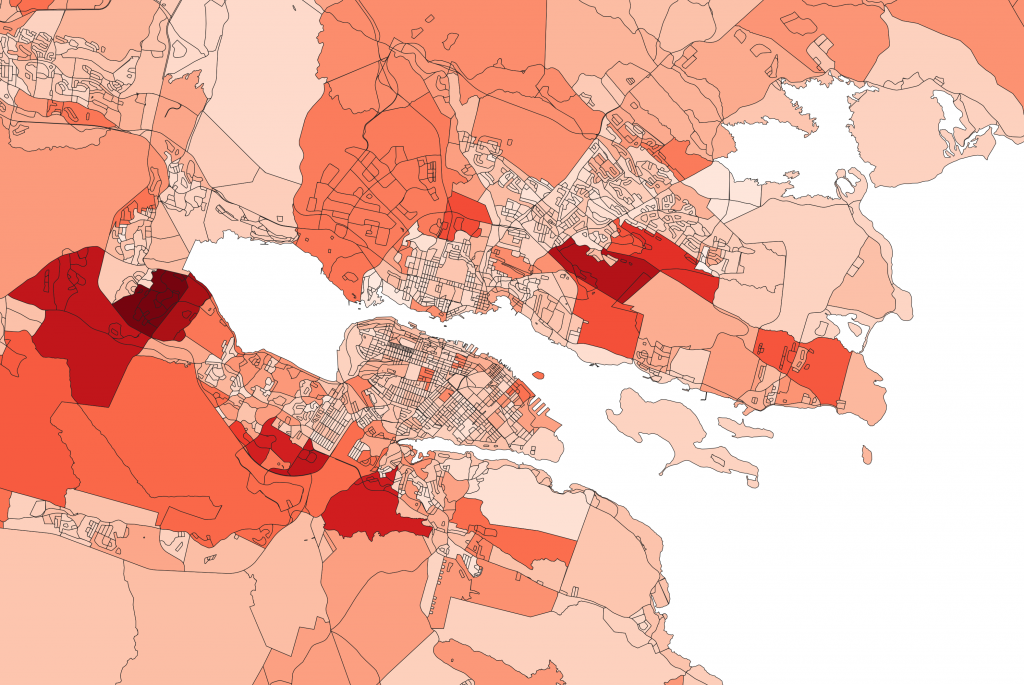
Day 26 – Choropleth
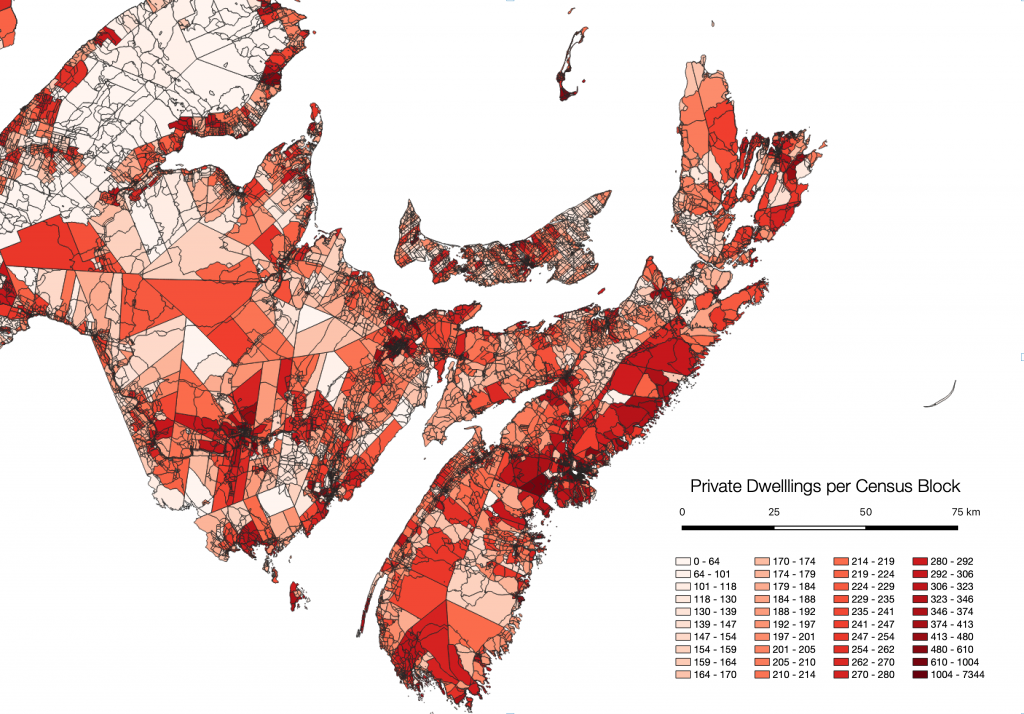
Mapping 2016 census, dwellings per census block in Atlantic Canada. I used the Population and Dwelling table joined to the dissemination area shapefile.
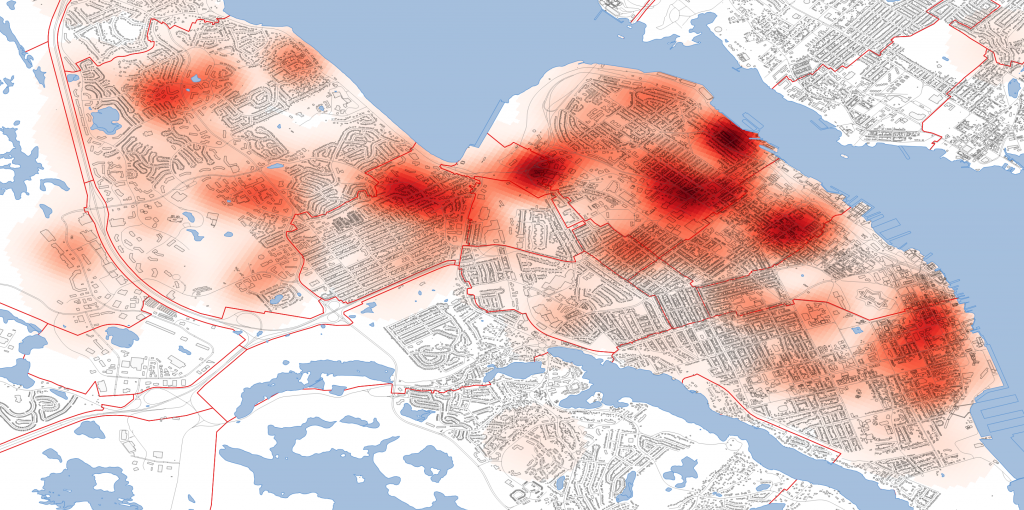
Day 27 – Heatmap
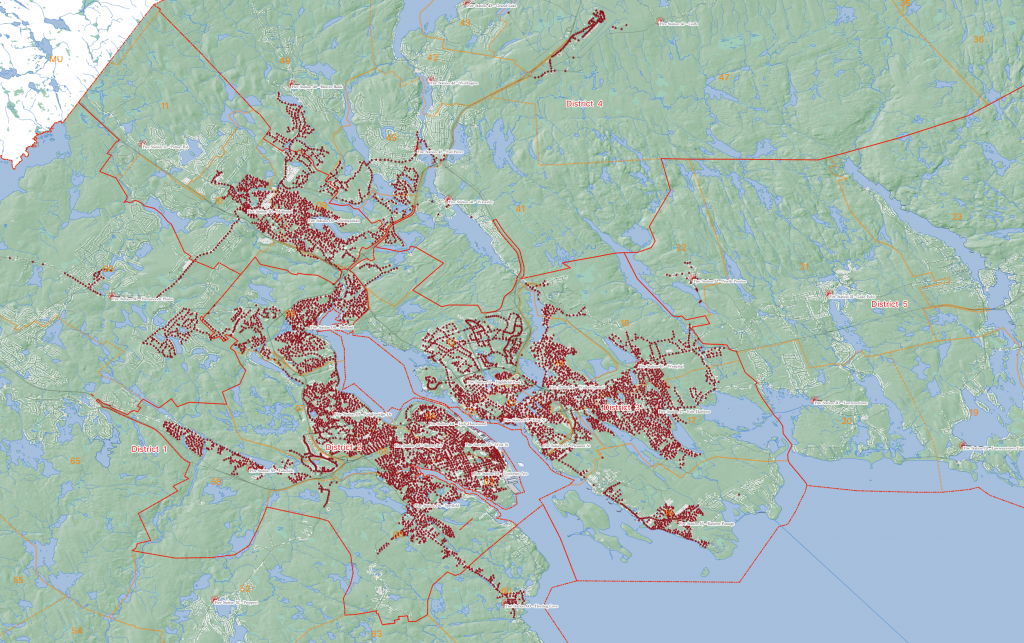
this map hows the density of station responses from January – July 2020. there were 460 source points to generate this heat map.
Day 28 – The Earth is not Flat
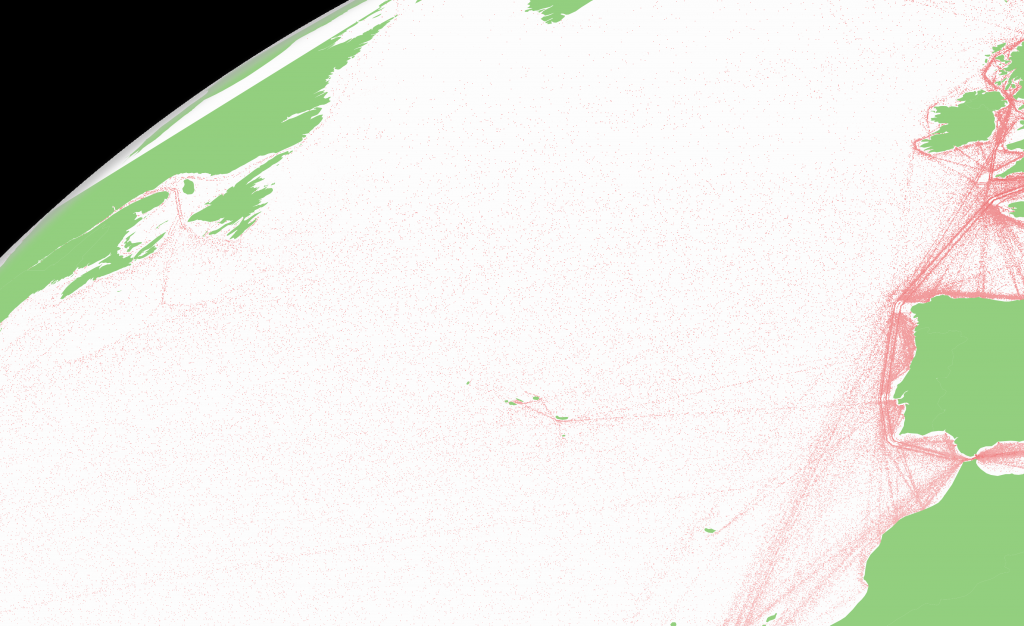
Global shipping density displayed on a globe. You can see the Great circle route from the Mediterranean to the Panama Canal decently well. Ship Density Data is from the world bank, and the globe was done with a QGIS plugin
Day 29 – Null
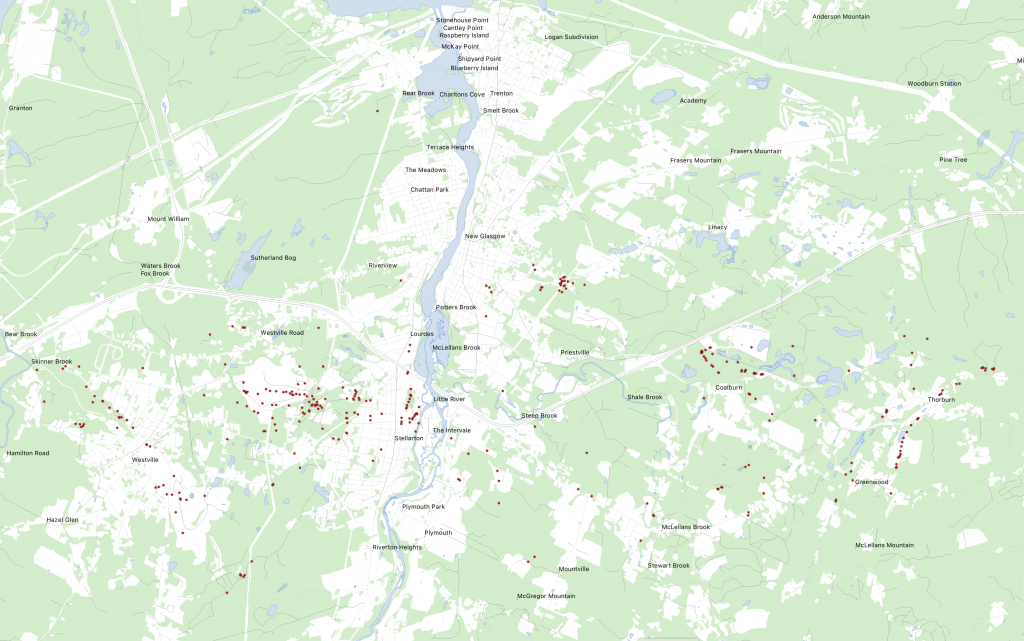
For Null, i mapped Abandoned Mine openings in Pictou County. Holes are null, abandoned things are null, so abandoned holes are double Null. Of note, looking at the provinces data, there were 2 Tungsten mines in Lower Sackville, A gold mine in Fairview, and a Arsenic Mine in Waverly. Data Set from the Province of NS
Day 30 – MetaMapping day
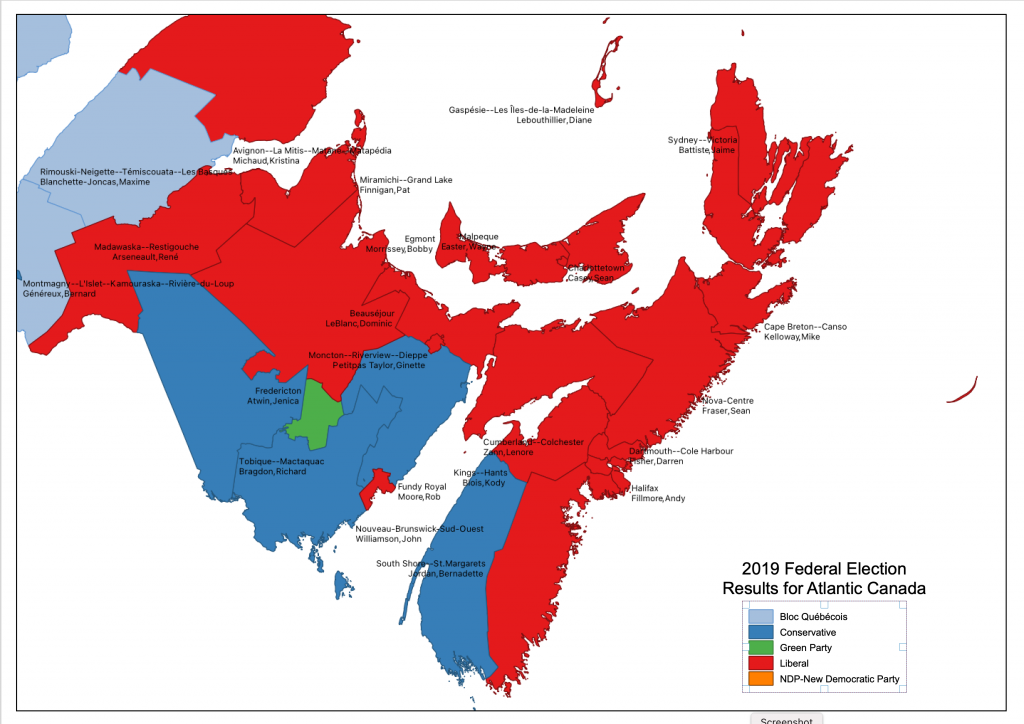
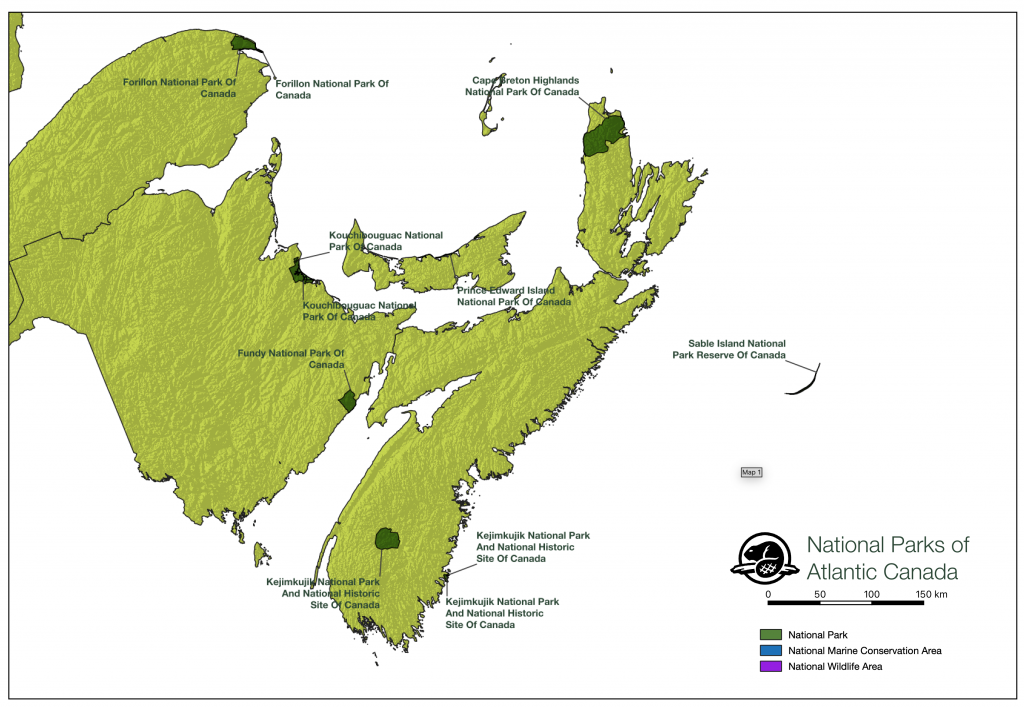
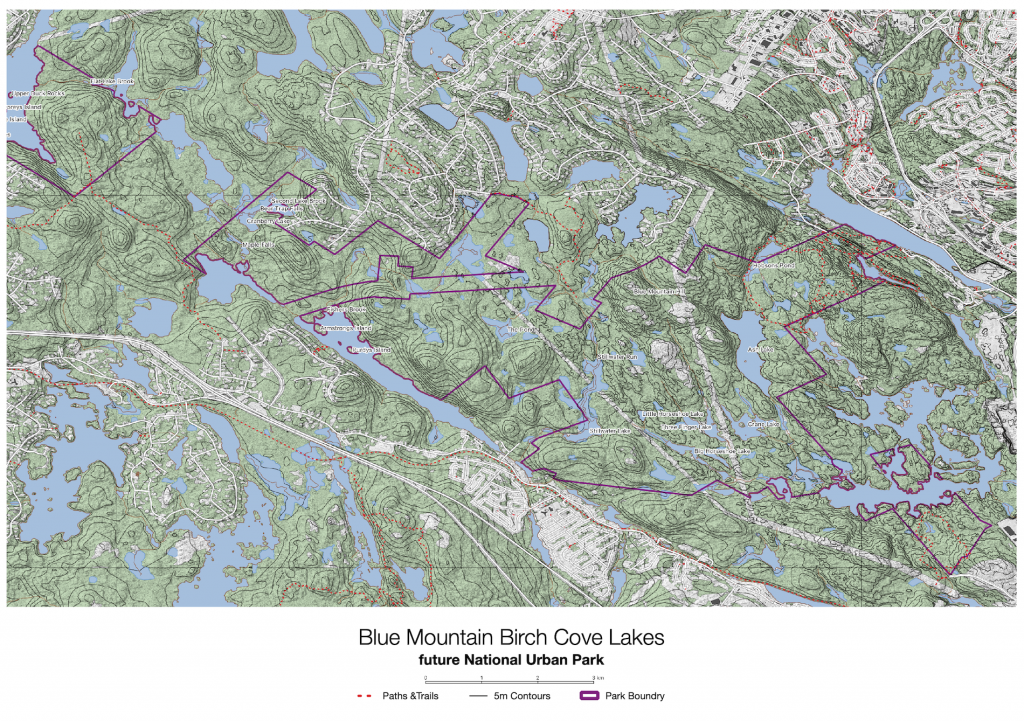
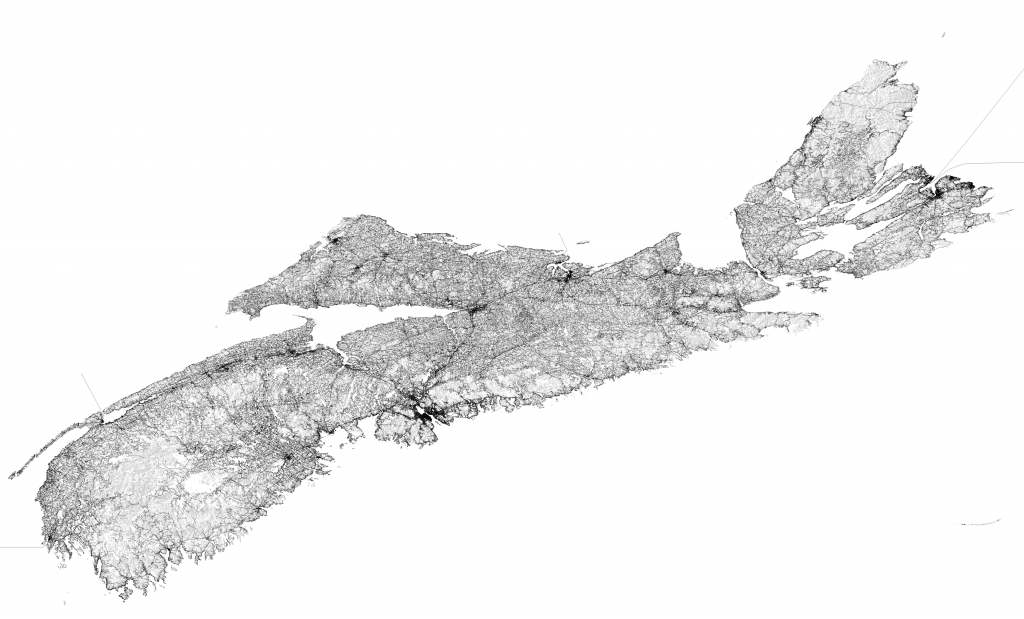
Meta data is data about data, therefore a Meta Map is a map about maps. That is the purpose of this post. to organize the 30 days, and guide you through it.

