the first complete medium icebreaker conversion from Davie arrived in Halifax today where it will be based. the First Ship, the CCGS Captain Molly Kool, was rushed into service, and only received a paint job. It will get the full conversion later.
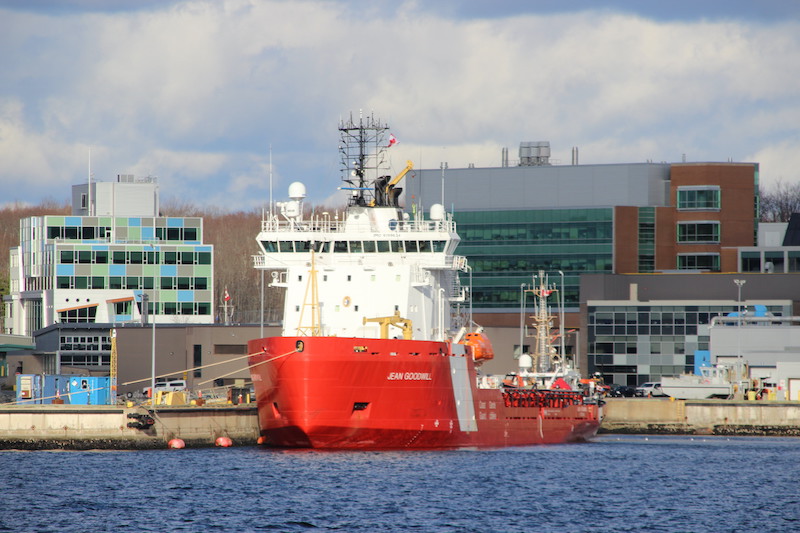
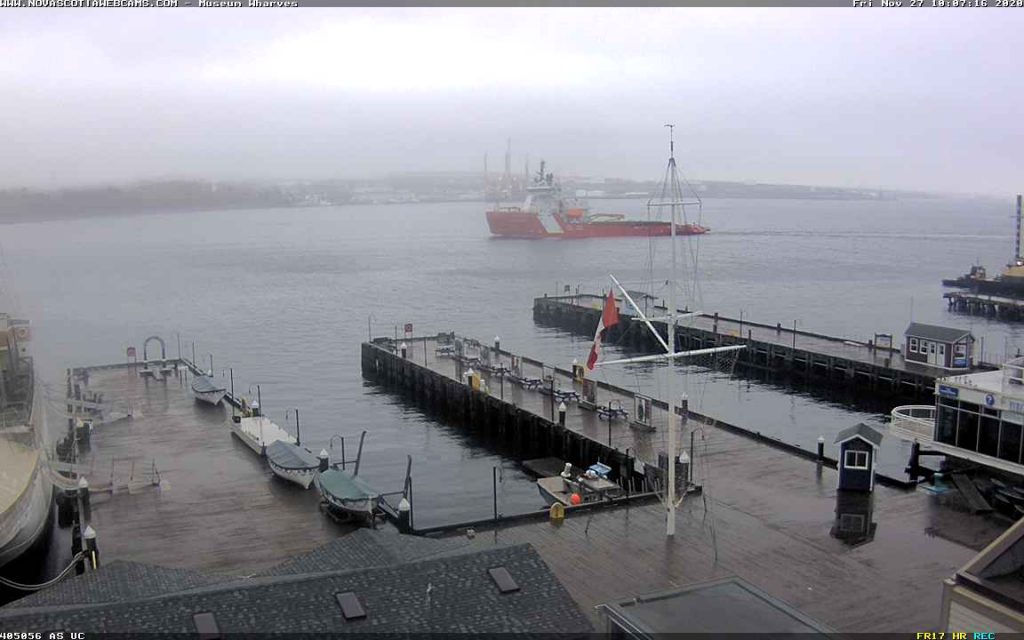
UPDATE – the ship docked at BIO, on the proper side of the jetty and facing in the correct direction. Below, CCGS Jean Goodwill entering Halifax for the first time, via Novascotiawebcams.com.
The Ship operated as Balder Viking between 2000 and 2018, the ship is named for Jean Goodwill (1928–1997), a Canadian Cree nurse who, in 1954, became Saskatchewan’s first Aboriginal woman to finish a nursing program
This post is going to describe a process to create a nautical chart. It will be done using Open Data, and QGIS 3.14 and is intended to be suitable for general interest audiences, as well as GIS Professionals.
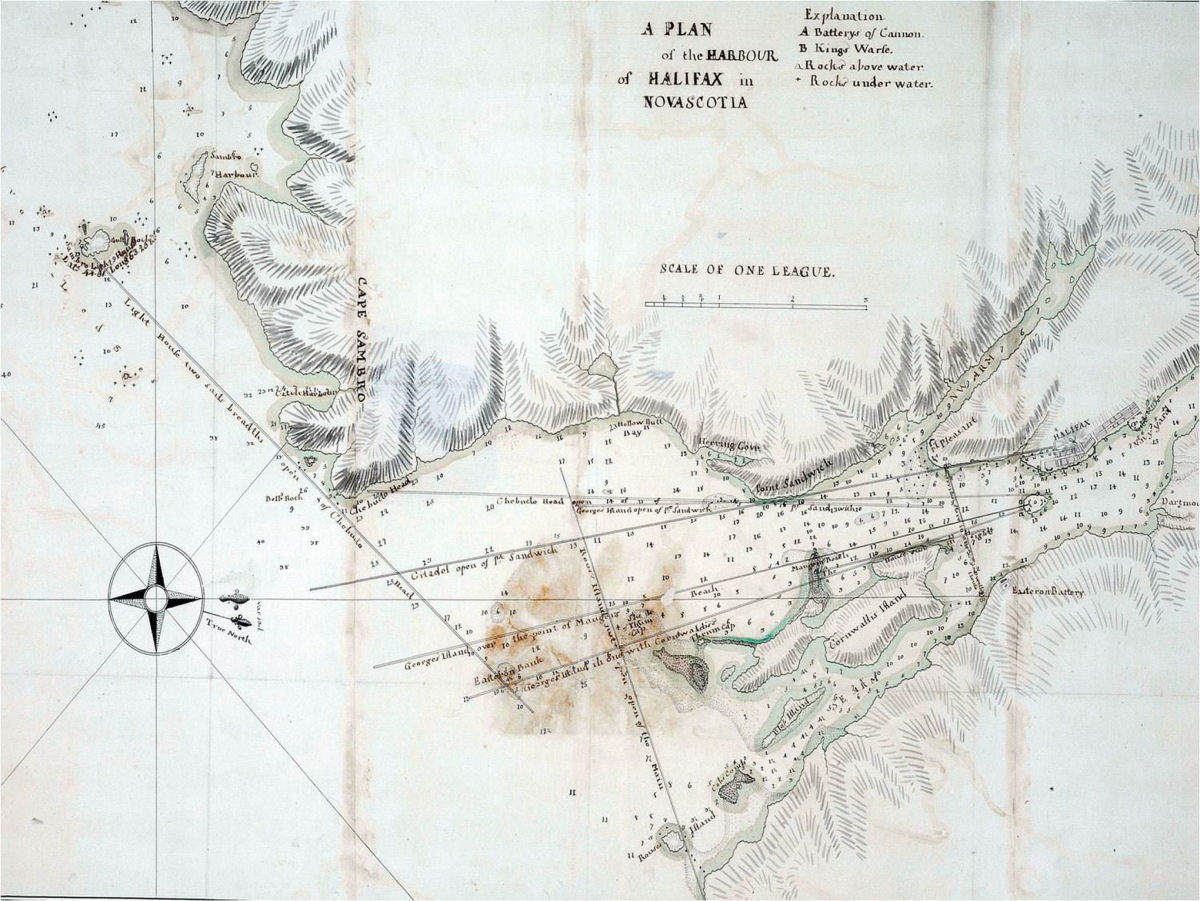
Chart of Halifax Harbour by James Cook.
nautical chart production begins with a Survey. In times past, surveyors would go out in a small boat and take soundings with a lead line. those soundings would be located via triangulation to survey monuments located on land, themselves accurately positioned by use of a sextant. the problem with this method however is that lead lines can only tell you the depth of the single spot. multiple soundings will give you a good idea of the general depth, of an area, but can miss isolated rocks and other hazards. Modern Chart production begins with Multi-beam Sonar scan.
Bathemetry
Multibeam sonar results are then rendered into a GeoTiff. A geoTiff is basically an image file that is geographically referenced, and each pixel contains height (or in this case depth) data. in this case we will make use of the CHS Nonna-10 data set. This data set is “non-navigational”, in that it is not considered reliable enough to use for navigation, but is suitable for our exercise.
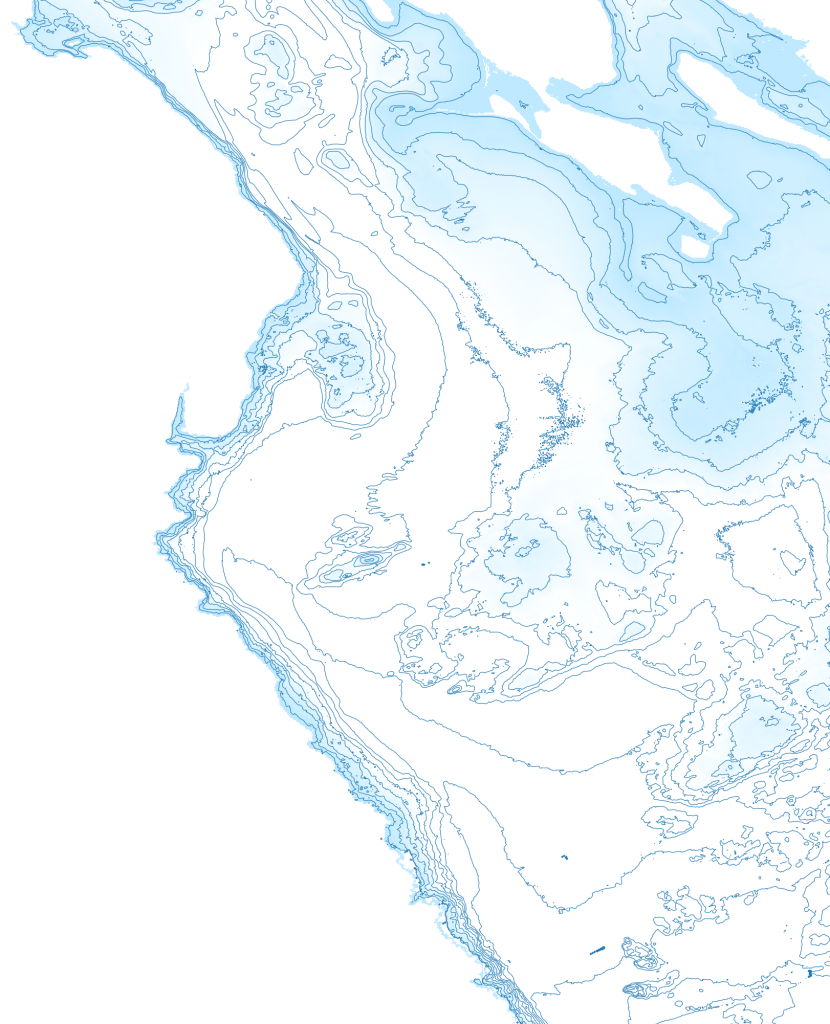
the ray greyscale NONNA-10 Data.
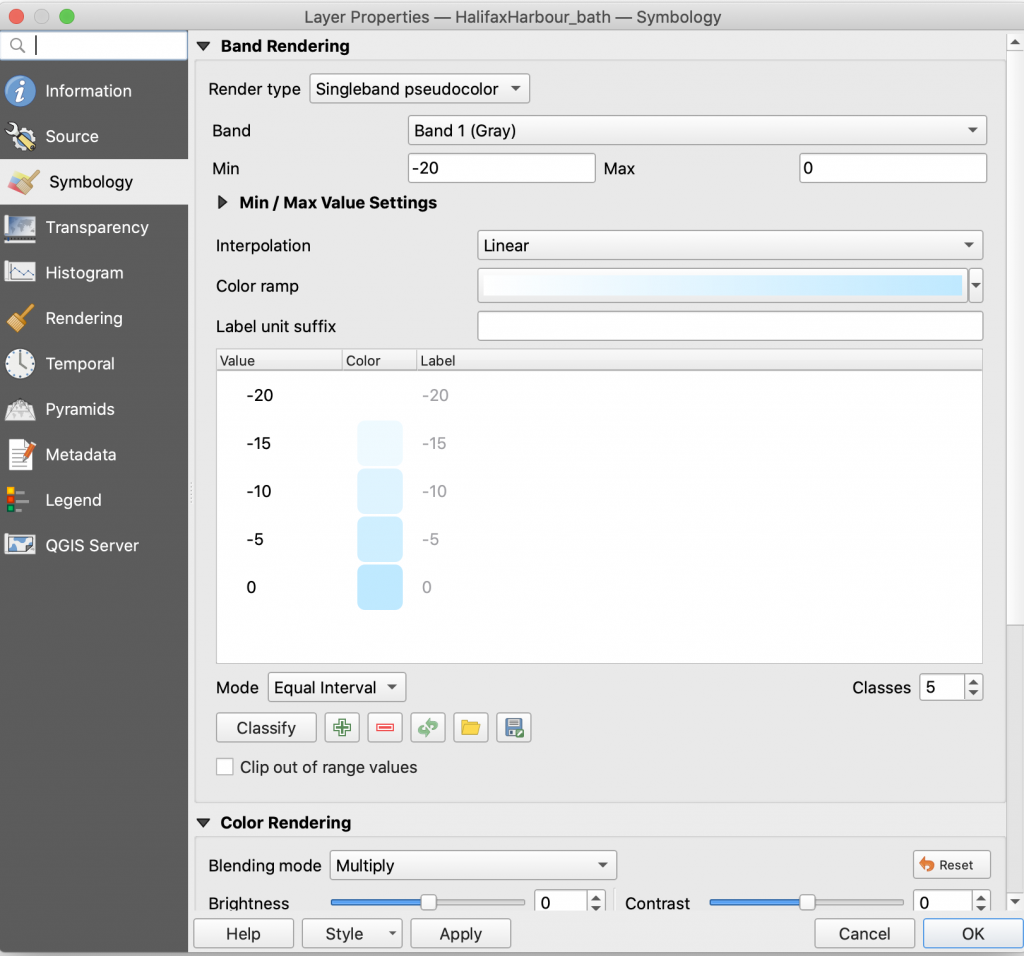
NONNA-10 data comes in individual tiles. once the tiles are loaded, we can perform a raster merge function to join them into a single file. Then change the render type to Singleband Pseudocolor, and apply a suitable color ramp. I chose a ramp that would give a blue highlight around the coast line, and white for waters 20m and deeper.
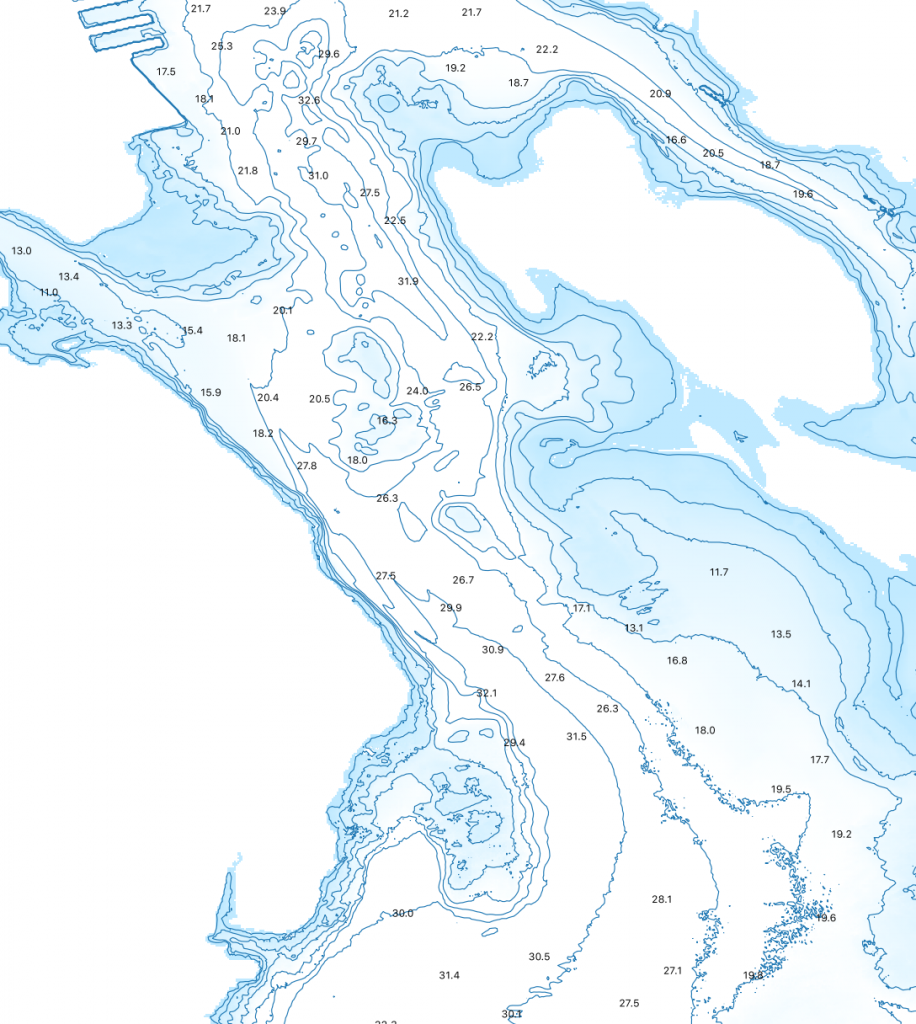
Next I Ran a Raster Extraction Contour, and set the Interval between contour lines to 5.00, to generate 5m contour lines.
to get spot depths, i created a new point shape file, creating a bunch of points. those points then get used in the Sample raster values tool, which pulled the depth value from the raster file and generated a new point layer. We set the transparency of the points on that layer to 0, making them invisible, and then applied a labels with the depth. Our Values came back with a – sign in front, so we used the equasion editor for the source set to replace(rvalue_1, ‘-‘,”)
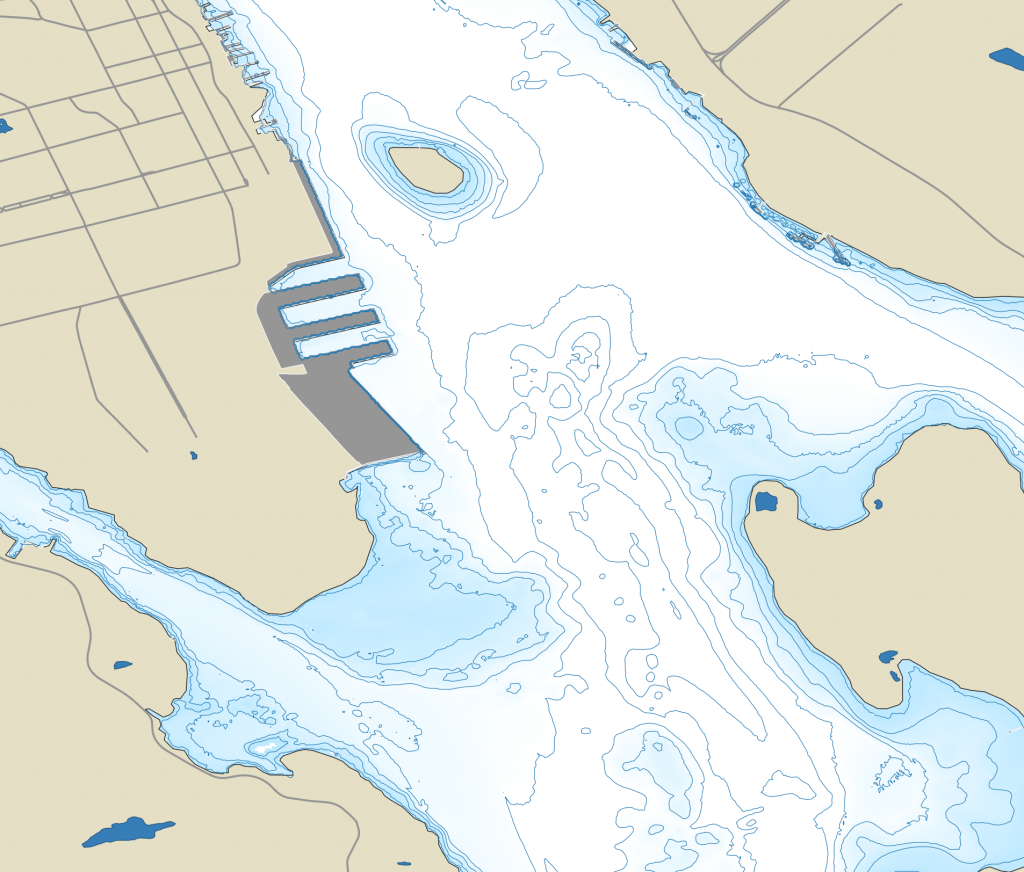
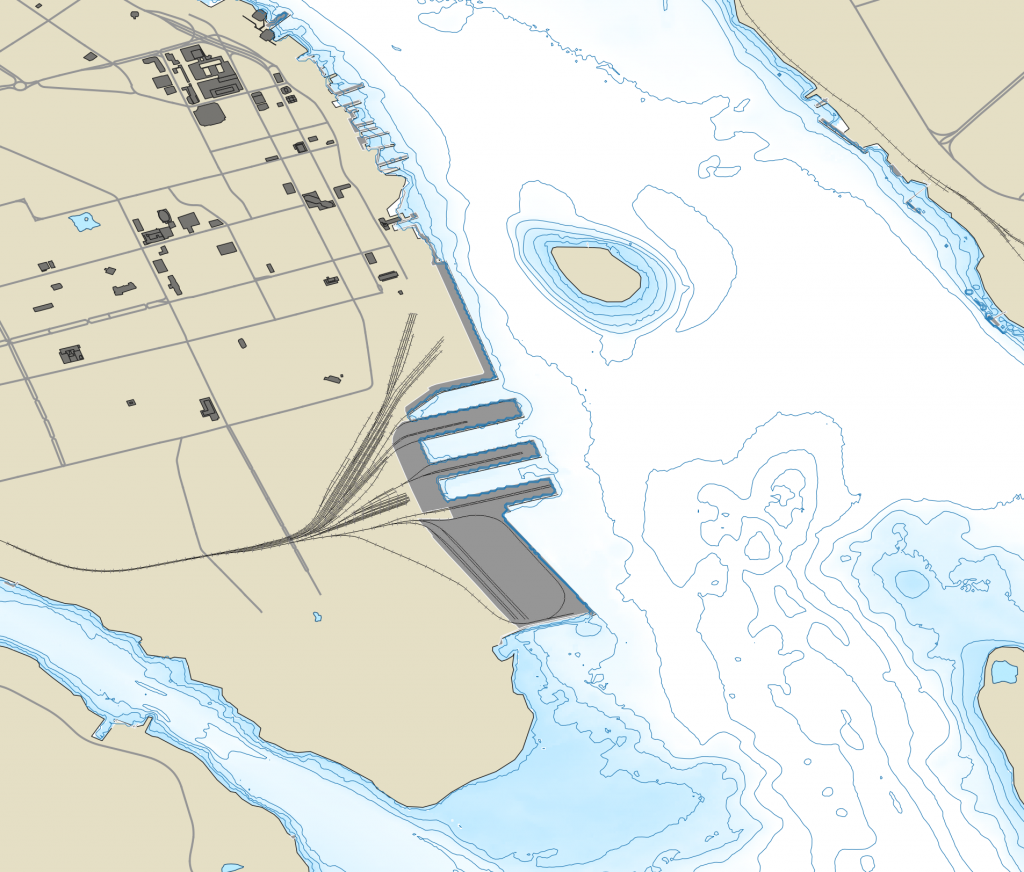
Land Features
Terrestrial Features were derived from the StatsCan boundary files and the Marine facilities and inland lakes from the Nova Scotia Topographic Database – Water Features Shapefile. Halifax open data has a street centerline layers that can be used to populate terrestrial areas. the center lines were adjusted so only the major streets were symbolized, all with a dark grey symbology.
the open data portal also includes a building outline layer and buildings over 6 stories were symbolized. unfortunately a number of buildings lack floor data, so significant ones will need to be edited to add values so they display – theses are mostly features such as the grain elevator, Emera Building, and various transit sheds at the port.
Nautical features are generated from a number of sources.
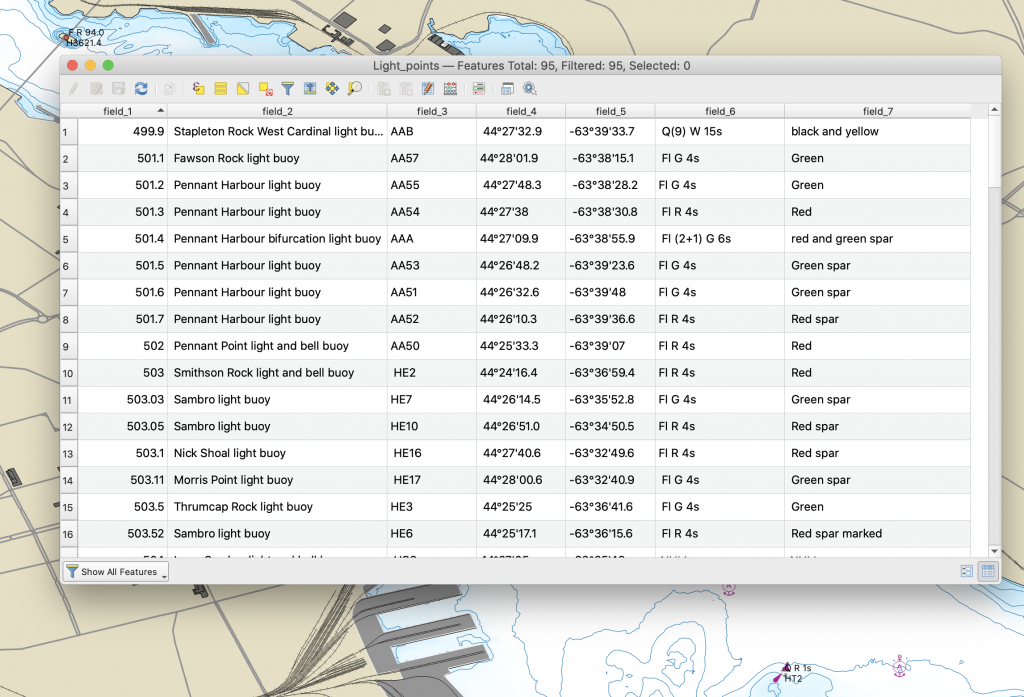
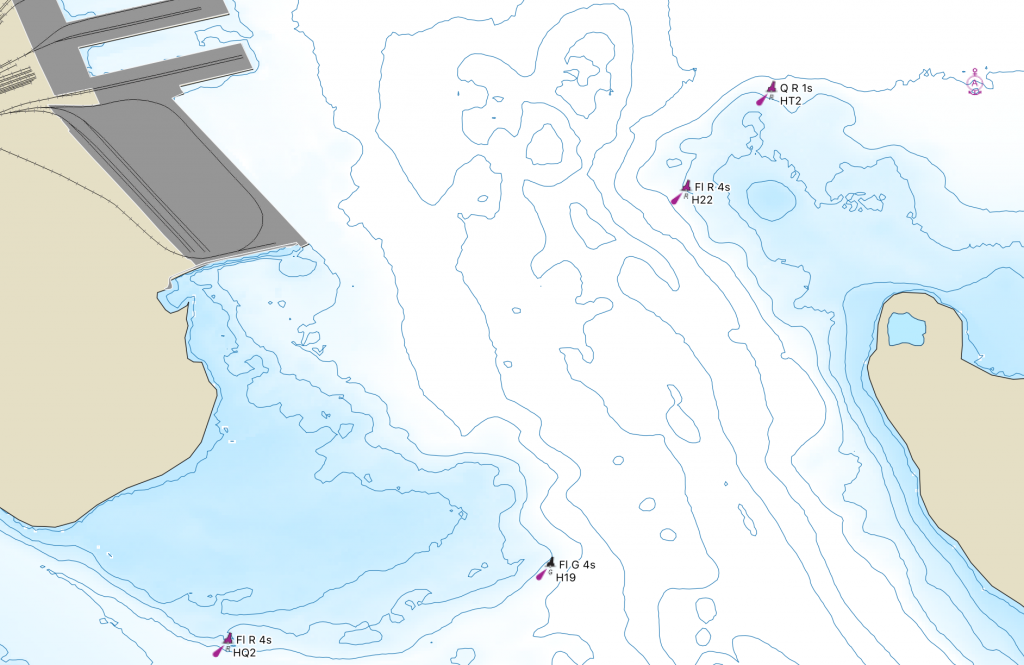
The list of Lights Buoys and Fog signals was converted into a point shape file, and then each type of buoy symbolized used the appropriate symbol from chart #1. The table includes the features name, code, position, characteristics and type.
the symbols are literally svg files taken form chart#1, and and then the individual buoy expanded. The Symbols are assigned based on the values in Field 7, and the features labeled with the light characteristics (field_6) and code (Field_3)
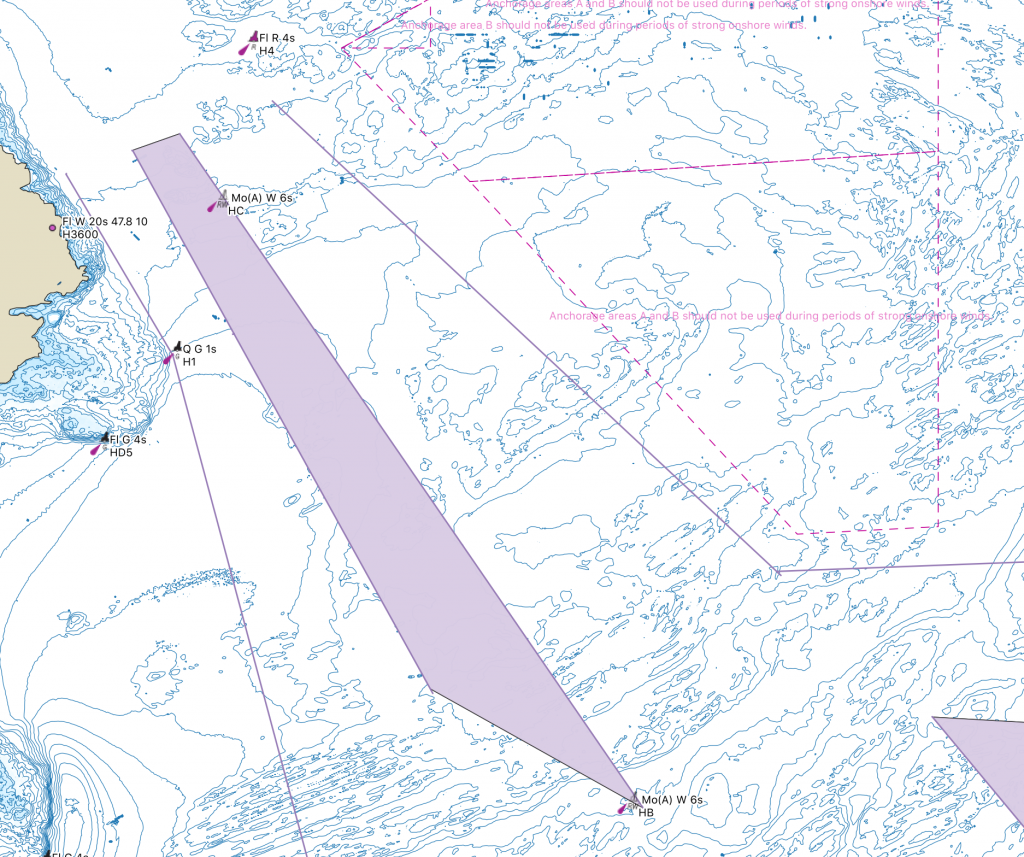
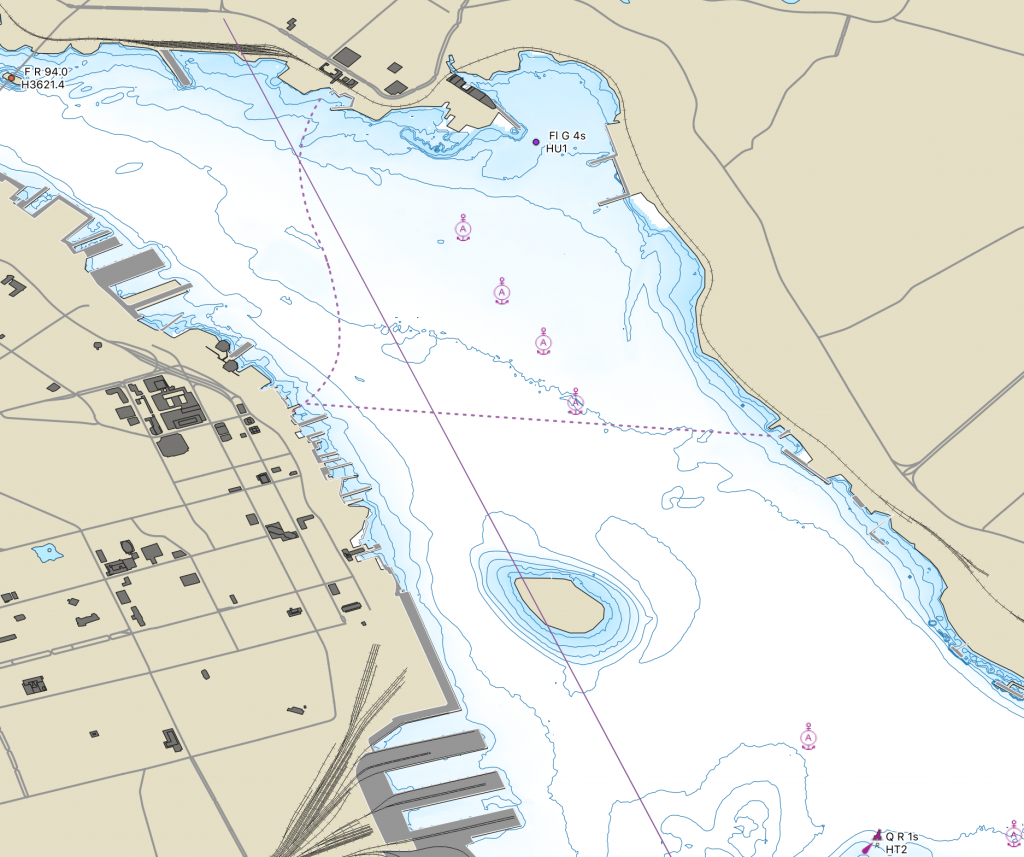
The anchorage data was provided by an open data set of Canadian anchorages. The inner anchorages are symbolized as above, and the outer Anchorage area was defined as a hollow polygon with a dashed line. The warning data was contained in the data set.
Traffic separation scheme in the approaches.
The traffic separation Scheme came from open data Vessel Traffic Routes. The traffic lanes in the outer approaches were edited to conform with CHS Charting practice, and to improve Appearance. The scheme also included data for Ranges, and the ferry track which were cleaned up and simplified.
Ferry Track, and Harbour inner range.
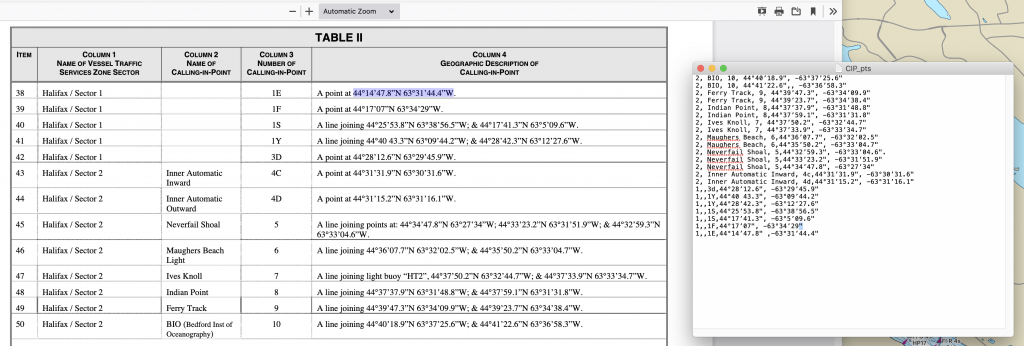
VTS Call in points were generated by creating a csv file of all the points taken from VTS Zone Regulations which define the Call in Points, then running the Points to path tool to connect them.
building the callinpoint shapefile.
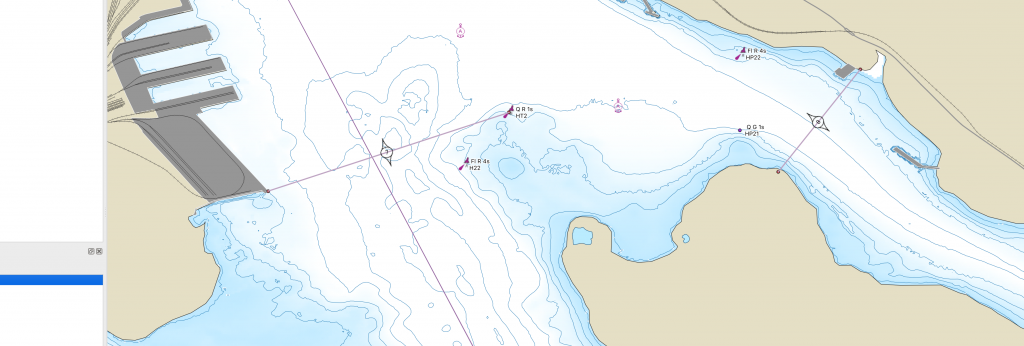
The Call in Points were then symbolized with a line, and the a label applied, using the SVG Callin point symbol as a background for the Label. Placement was arranged to centre the point number in the centre, and have the symbol span the line.
Call in points 7 (Ives Knoll) and 8 (Indian point)
Producing the Chart
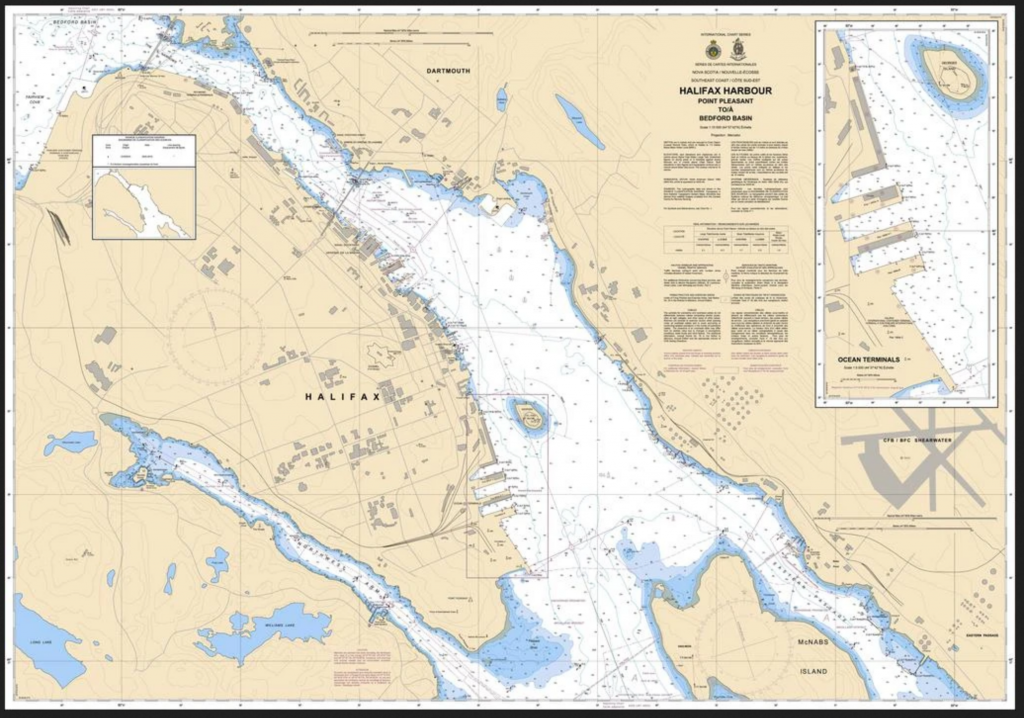
With all the elements digitized, its time to produce the actual chart. In this case we will produce Chart 4202 – Halifax Harbour Point Pleasant to Bedford Basin.
CHS Chart 4202
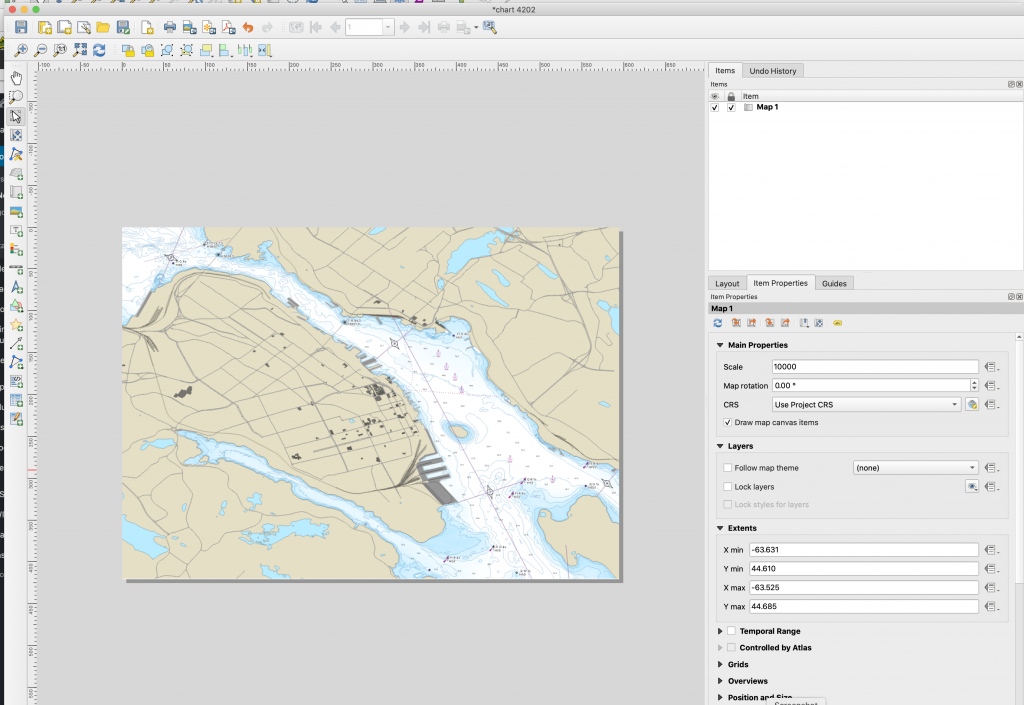
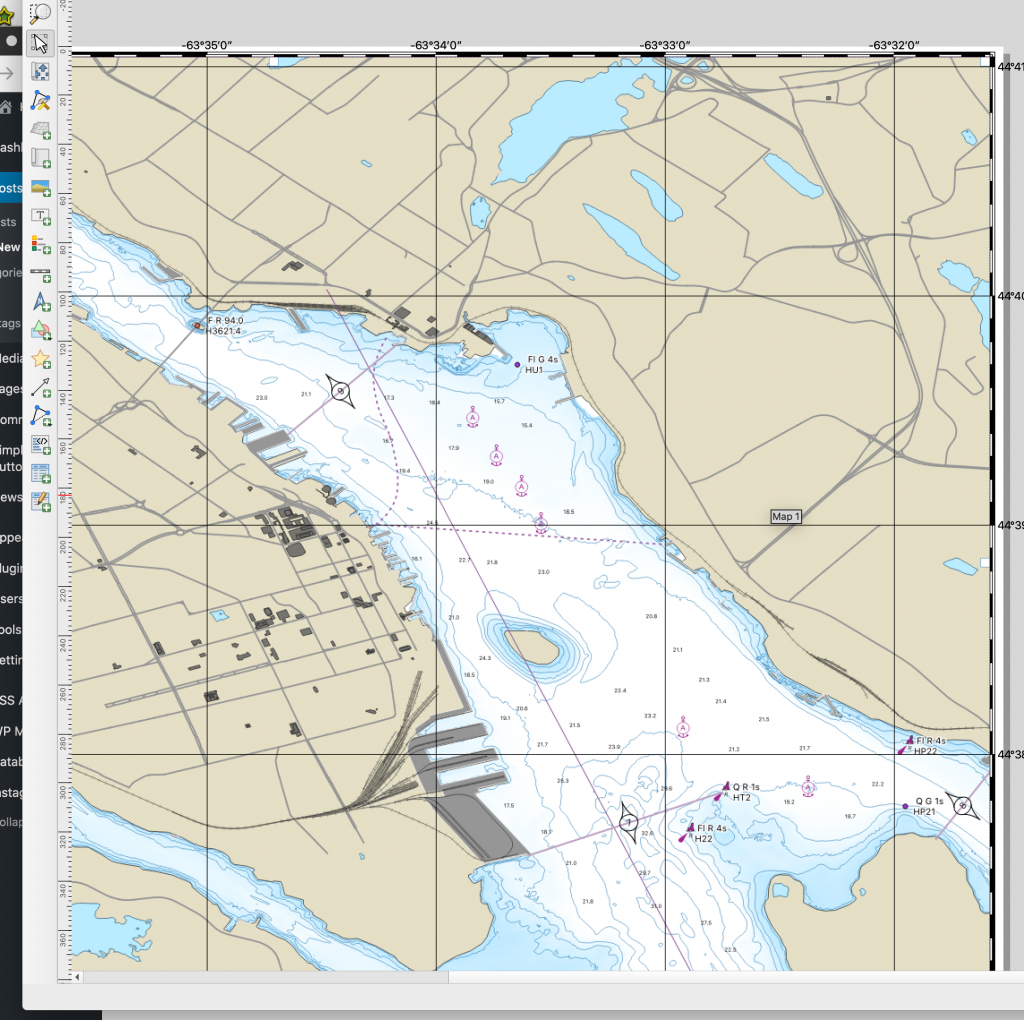
to Produce the chart, we create a new print layout, i called mine Chart 4202. i edited the page size to be Arch E paper, which is 36×48. add the map box, and the chart will render. Nautical charts are typically 1:10000 scale, so i set the scale to 10000, then adjusted placement so that the inner harbour is covered.
Then we need to change the projection to Mercator. to do so we adjusted the CRS to NAD83 CSRSv6 MTM zone 6
to get the border we want, we add two grids. the first is the standard 1minute interval using a value of 0.016660. we offset by X =20 and y=3 to get the grid to line up to even numbers. The second grid is a frame only, with the X and Y interval set to 0.001666666667 to give us 10ths of a minute. Both grids were done with the Zebra Nautical style. both grids use the WGS84 CRS.
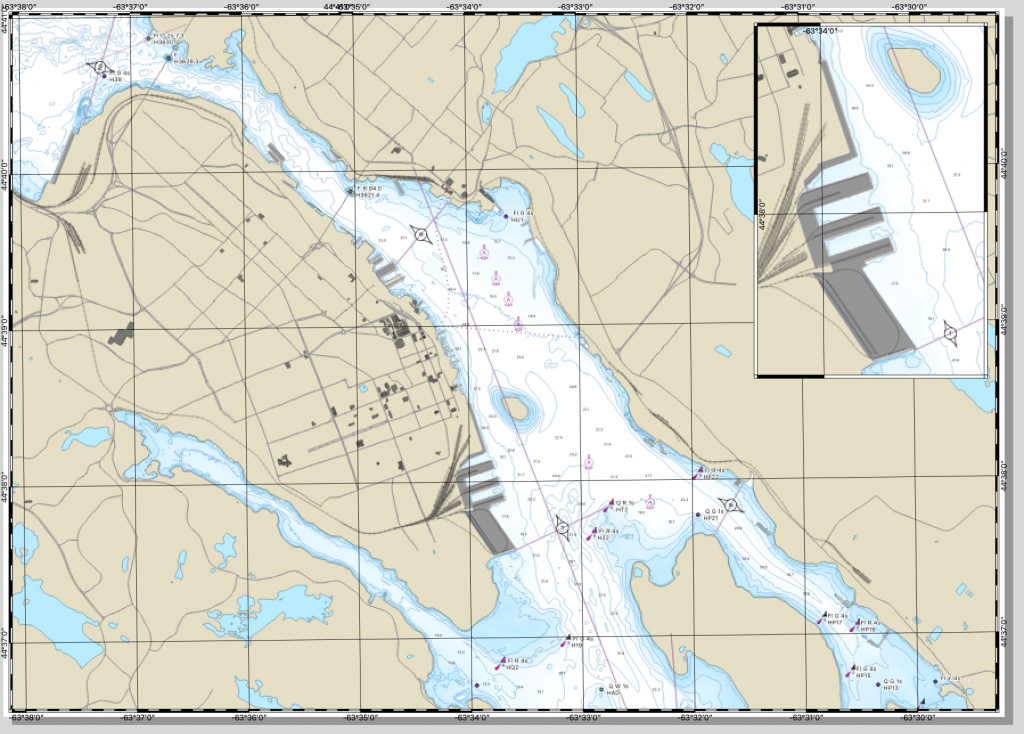
The inset Chart of the South end terminals is created much the same way – its simply a second map window sitting on the first.
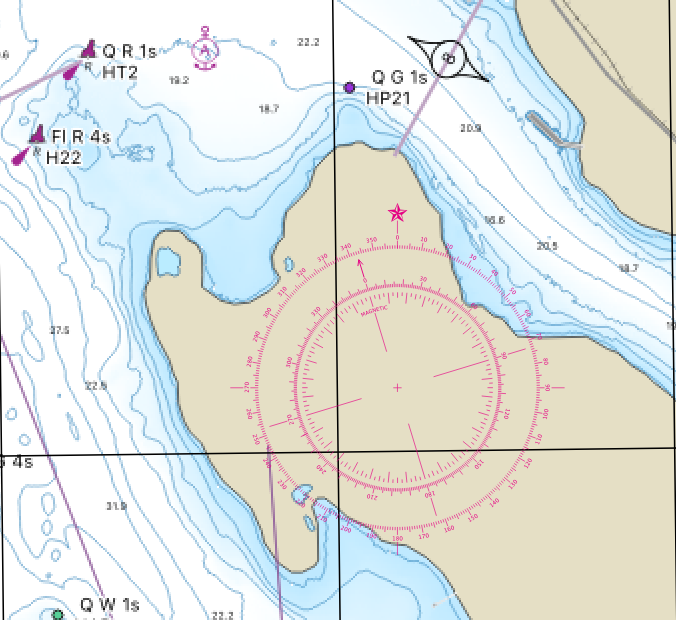
from here we can add a couple of compass roses. these are svg images, with the inner getting rotated and set to the correct position.
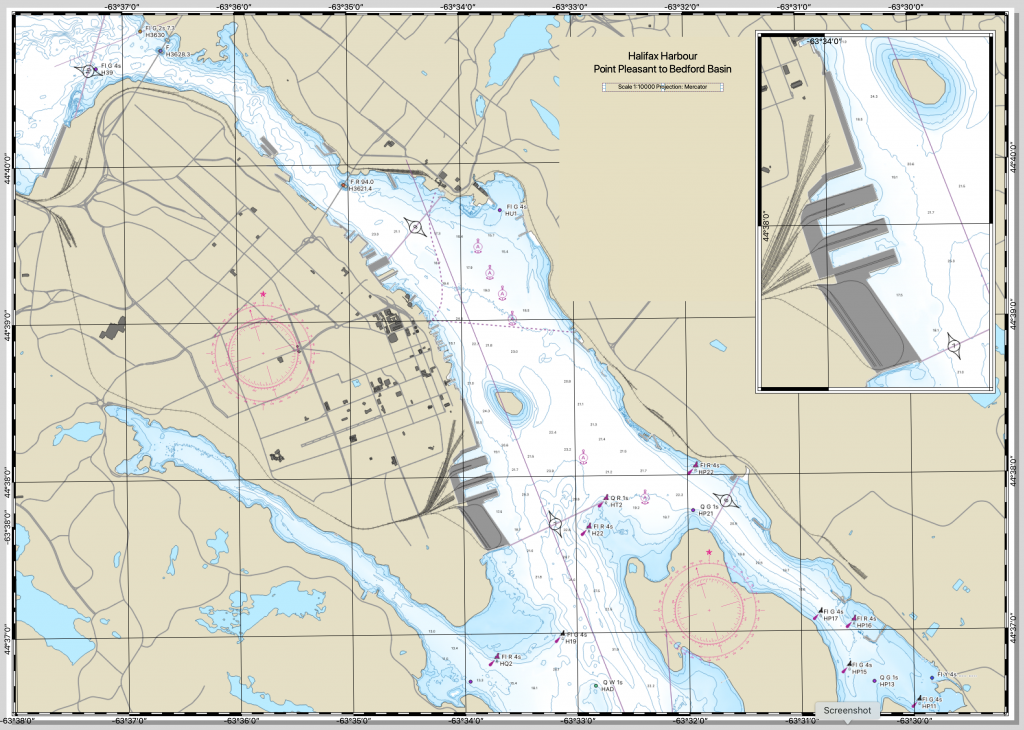
then all that’s left is the title block, and any additional notes you want to add.
the finished chart
Please note that for the sake of time, not all details were rendered in the chart at this time (Some buoys are not symbolized, not all depths are present. title block is mostly blank, etc.)
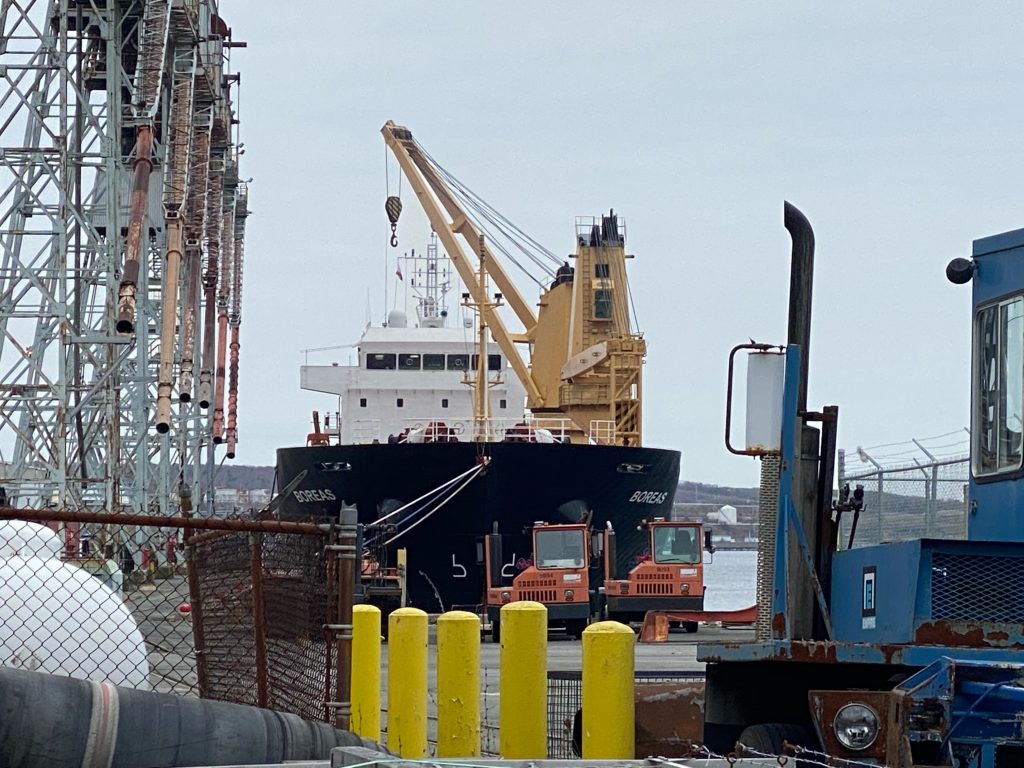
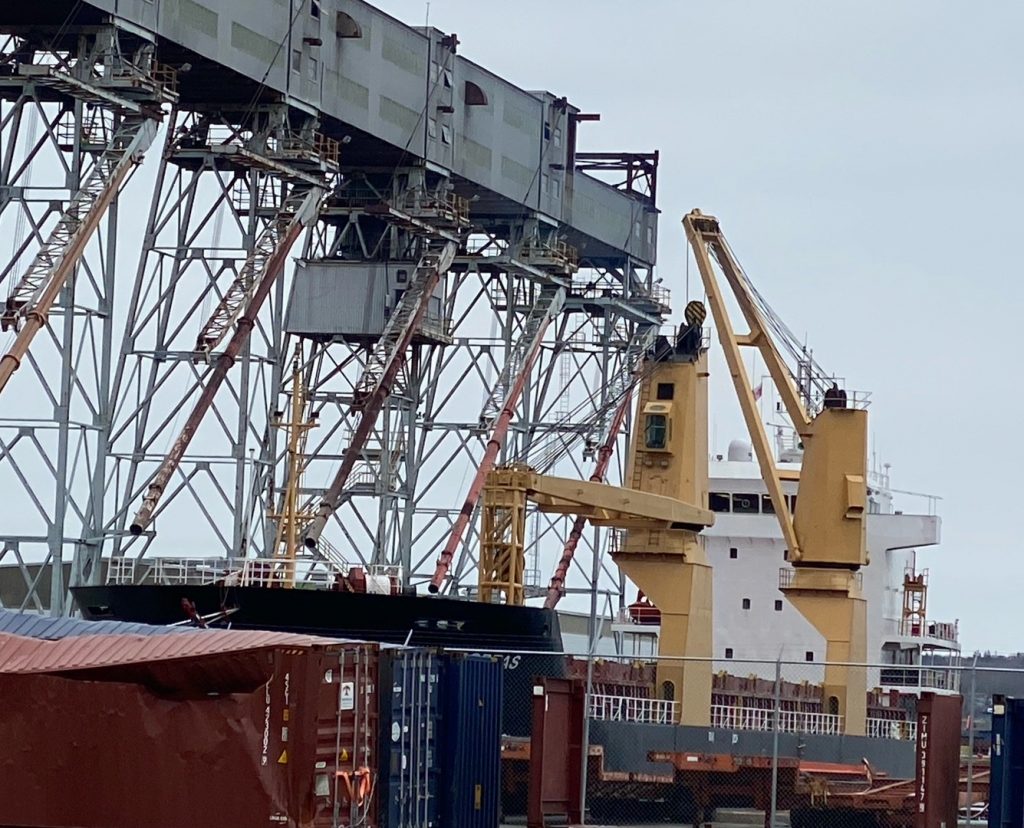
the general cargo ship Boreas sailed for Havana Cuba today after loading a cargo at the grain elevator at Pier 28.
the ship was built in 2008, and is a petite 116m in length. and has been in the Cuba trade as of late making trips to the Island from Dakar, Spain, Las Palmas, and Jamaica.
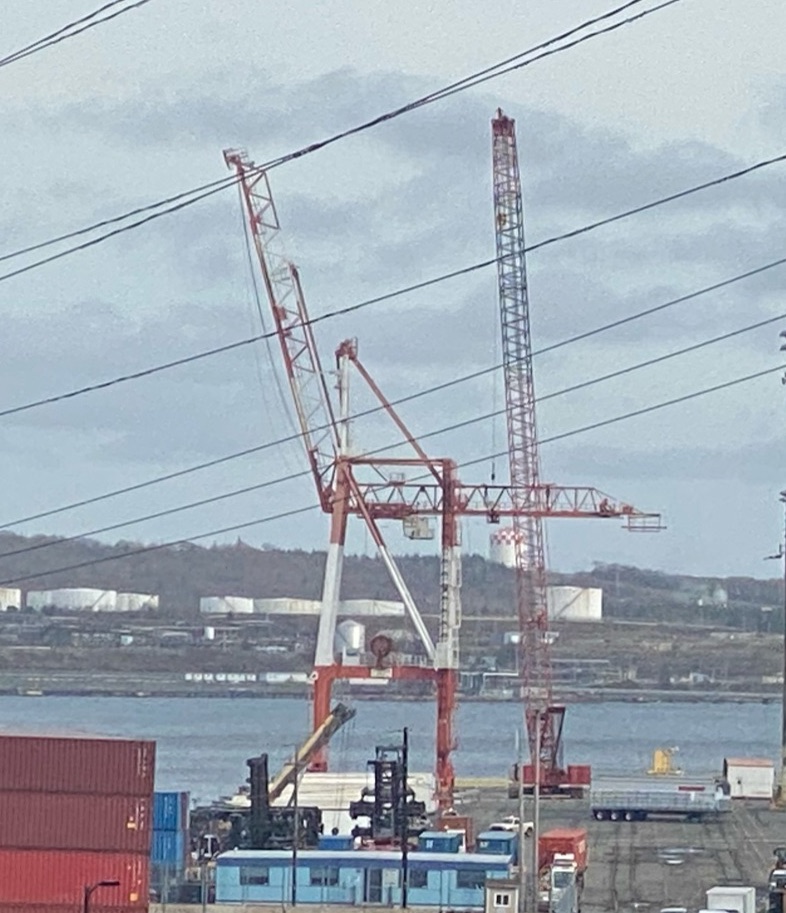
PSA Halifax has begun to disassemble and remove the last of the original Halterm cranes from alongside pier 36. The crane has been out of service for the last year, after it suffered a mechanical failure.
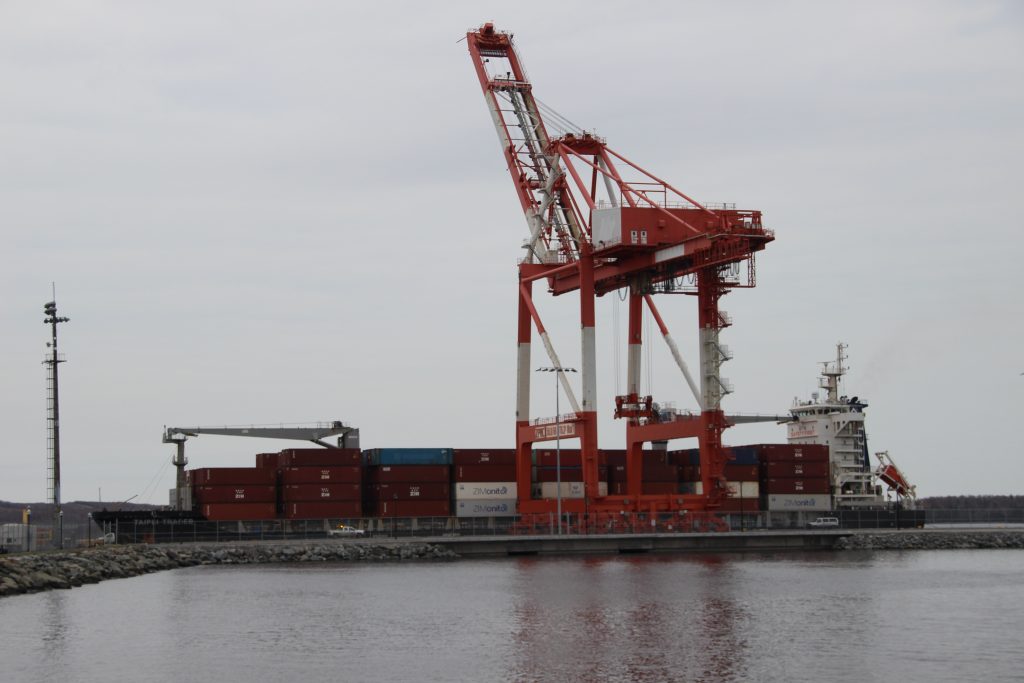
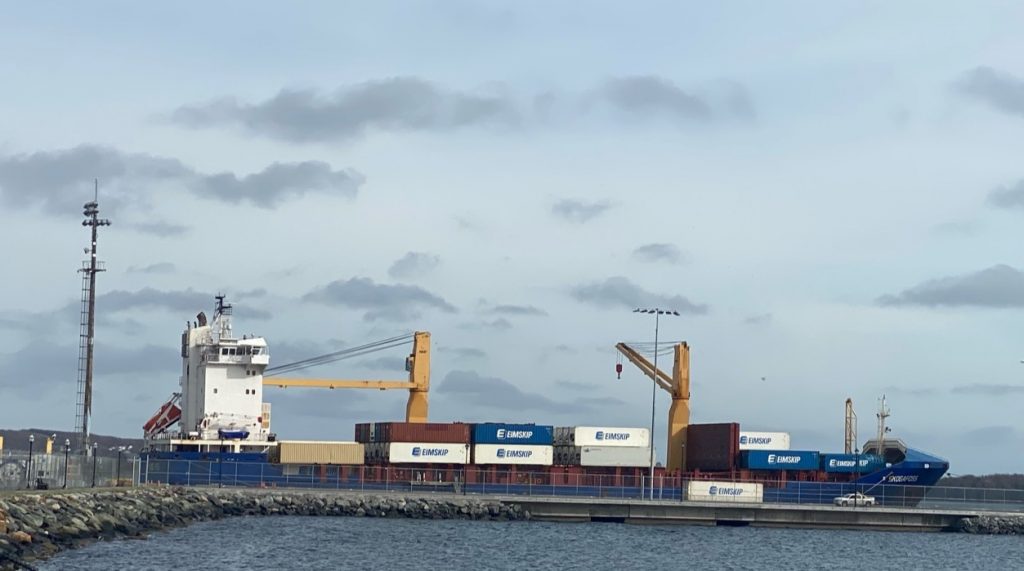
Taipei Trader made good use of the extended pier at PSA Halifax. the ship serves on ZIM’s Feeder service, and Connects Halifax, and New York with ZIMS transshipment facility in Jamaica.
Of note, the ship is facing in the opposite direction to normal.
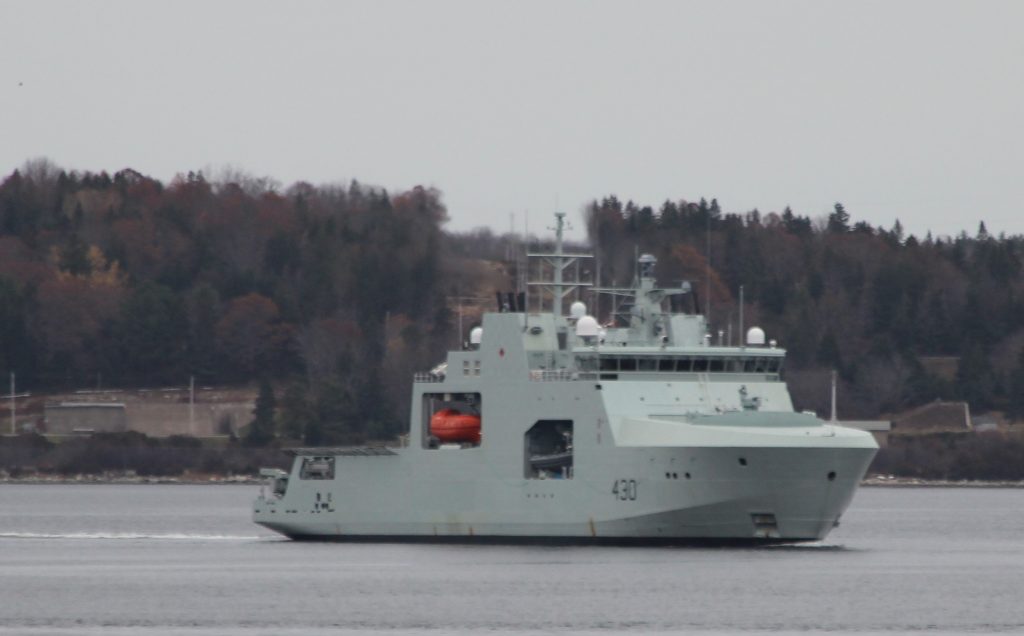
HMCS Harry Dewolf continues workups, most recently in the basin, spending most of the day sailing in circles. The ship was anchored last night off the Ammunition Jetty, and looks to have returned to anchor there again tonight.
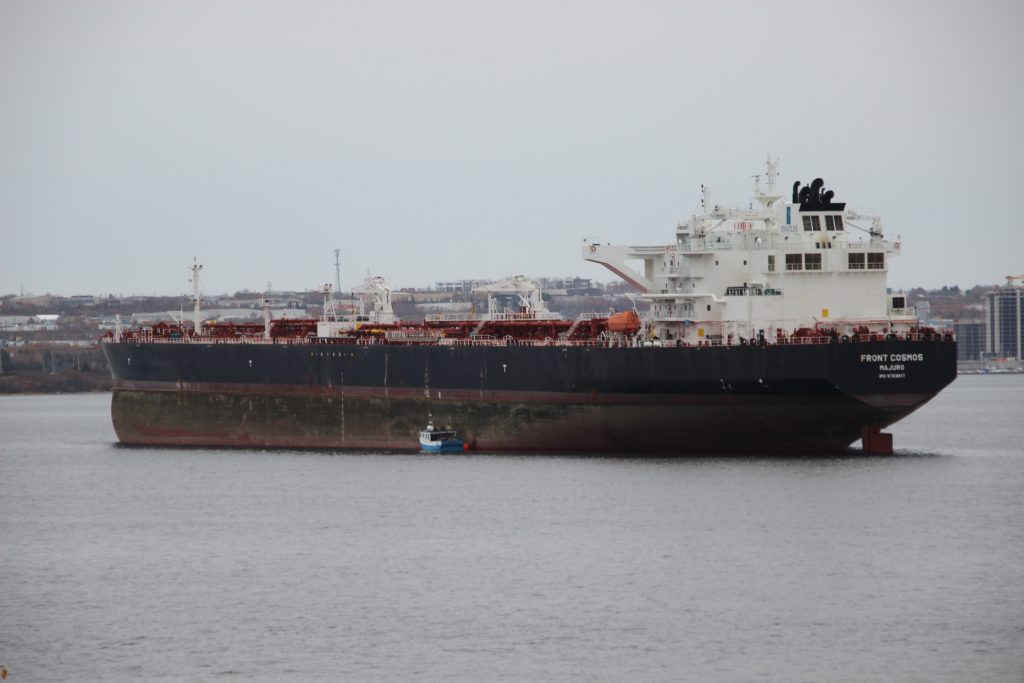
The Crude oil tanker has taken a far northern anchorage in the basin suggesting the ship is planning to stay a while while looking for its next gig. the ship arrived from Saint John NB after discharging its cargo.
The new Pier extension is great for photographing the smaller ships that call at PSA Halifax, as it provides an almost unobstructed view of the vessel.
the pedestrian lookoff is back, though some handrails remain to be installed, before it can be open to the public again.
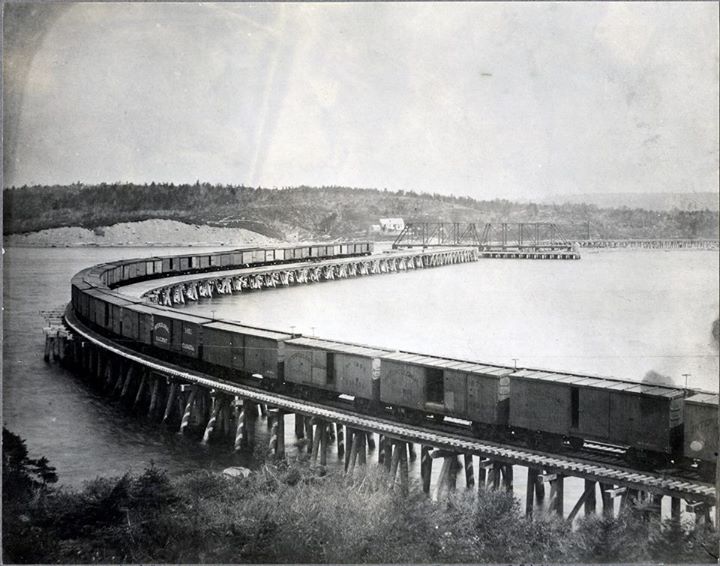
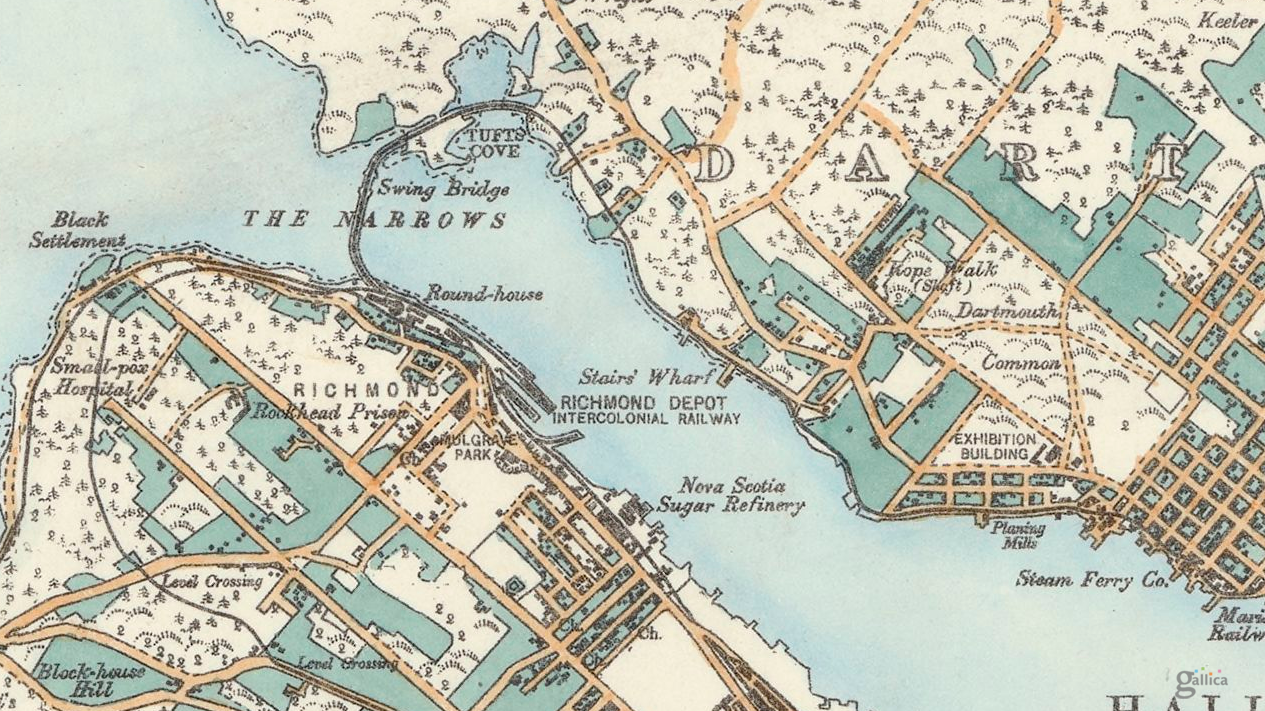
The first bridge spanning Halifax Harbour was a railway bridge constructed by the Intercolonial Railway at the Narrows. It was constructed between 1884-85 and was 650 feet long.
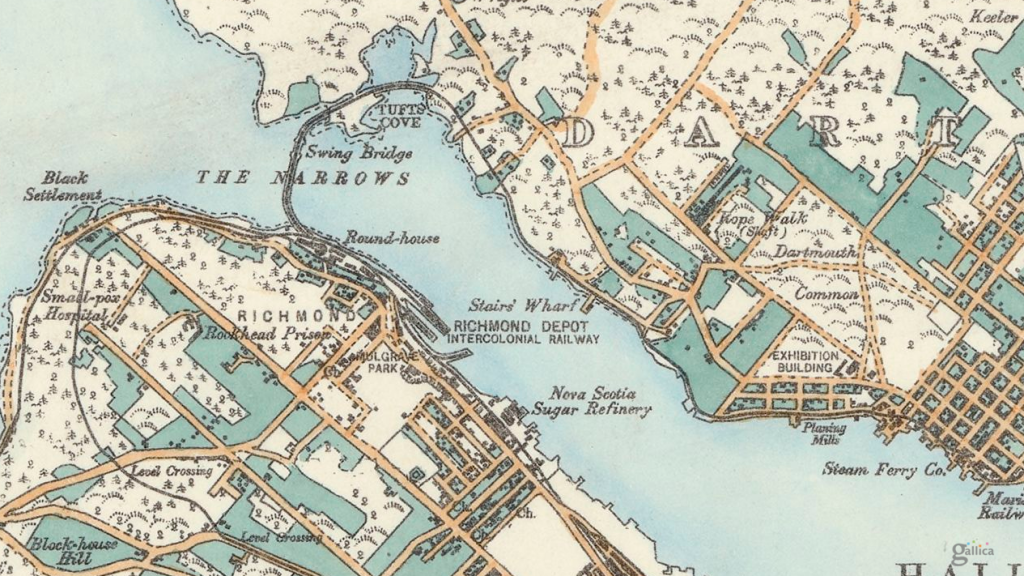
1889 Hopkins Map of Halifax.
Intercolonial Railway engineer P.S. Archibald designed the bridge in a concave form with the convex facing Bedford Basin in the hope this shape would help the bridge withstand ice slides each spring.
A Dartmouth man, Duncan Waddell, was in charge of construction for the huge stone pier upon which the swing section or “draw” of the bridge would rest, so vessels could be allowed to move into Bedford Basin. The stone pier, located near the Dartmouth shore, was constructed in about 35 feet of water, by driving piles into the gravel bottom to a depth of five or six feet. These acted as guides for building the pier, which was to hold the bridge, being built by the Starr Manufacturing Company of Dartmouth.
The wooden trestle-work of the bridge, constructed by M.J. Hogan of Quebec, rested on eight foot stone-filled cribs, spaced on the harbour bottom every 10 feet (3.0 m). The piles were then secured to the cribs. As the depth of the water was about 75 feet the piles had to be built in three sections, and spliced with eight-inch deals (basically an 8″ long plank) spiked into place. This proved to be extremely weak, especially when no form of side-bracing was used.
A hurricane hit Halifax on Monday evening September 7, 1891. The storm caused damage to wharves and shipping in harbour. The bridge was destroyed. Nothing remained the next morning but a few broken timbers and some trestles in shallow water.
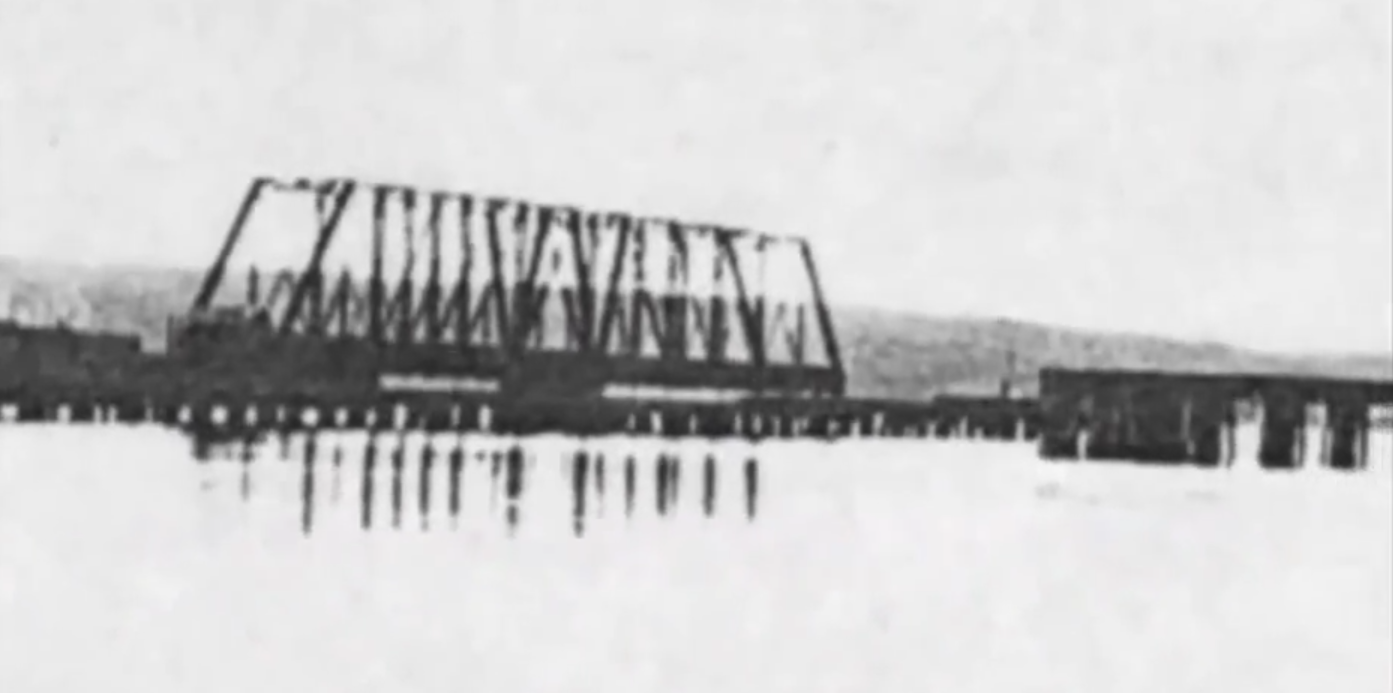
Suggestions were put forward by Dartmouth Town Council that it would be better to construct the railway line along the shoreline from Bedford to Dartmouth, rather than rebuild the bridge. However, the federal government decided to rebuild the structure, stating that the land route was not “deemed advisable.” Like the first bridge, it was poorly constructed and not braced. This time it was built in a straight line and thus made much shorter. Completed in 1892, the contractor was Connor’s of Moncton, New Brunswick.
About 2:00am, on July 23, 1893, almost two-thirds of the bridge slipped into the water. The last train had crossed about 6 hours prior. The cause of the breaking away of the Narrows Bridge was to be the result of sea worms. It was discovered that the piles were worm-eaten almost through between high-water and low-water mark. When the last train went over, it is assumed that these rotten supports gave way, but remained resting on the surface. Then, when the tide rose, the bridge desk floated up and the whole thing swept away.
The loss of the second bridge then led to the establishment of the rail line to Windsor Junction in 1896. The third harbour crossing is the Macdonald bridge.
The firm of Monsarrat and Pratley were engaged to carry out studies of a possible high-level highway bridge linking the 2 sides of the harbour as far back as 1928. The bridge location between North Street in Halifax, and Thistle Street in Dartmouth was approved by Dominion Authorities and the British Admiralty in 1933. The 1945 master plan for Halifax assumed that this would be the location for the bridge, and suggested widening North Street to accommodate traffic. Dartmouth’s master plan of 1945 also assumed this would be the location.
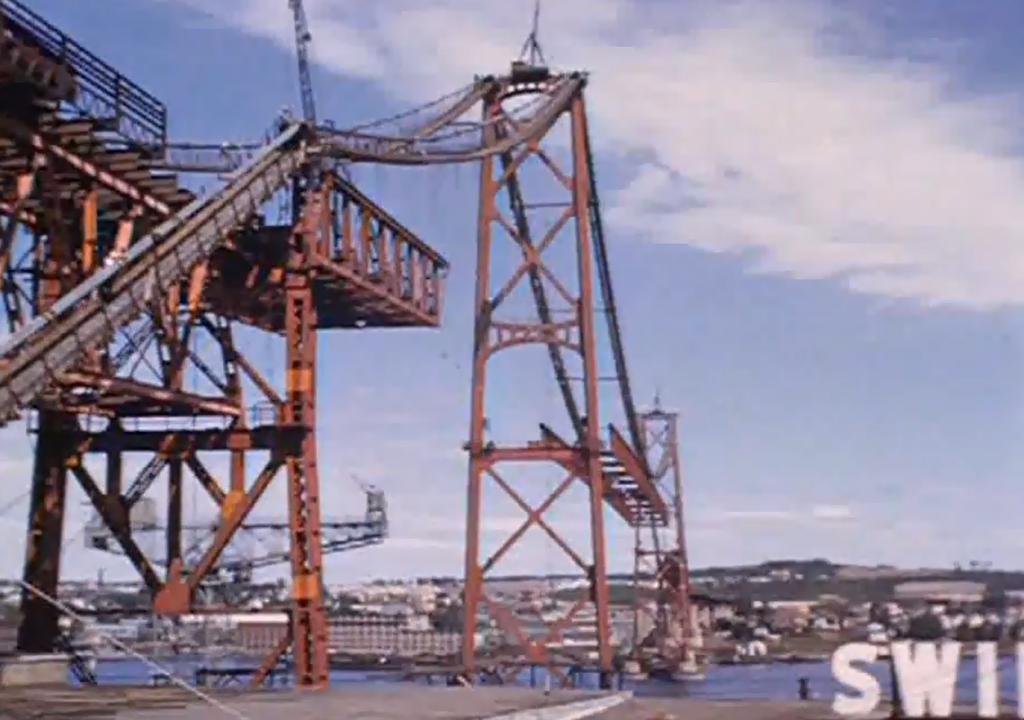
The bridge was designed by Philip Louis Pratley, one of Canada’s foremost long-span bridge designers who had also been responsible for the Lions Gate Bridge in Vancouver. By the time design work began in 1950, he was working alone. The contractor was Dominion Bridge Company Ltd. When erected at a cost of CAN $10.75 million, the Macdonald Bridge was the second longest span of any suspension bridge in the British Commonwealth, after only Vancouver’s Lions Gate.
Pratley worked on many of the large bridges in Canada, including the Jacques Cartier in Montreal, the Quebec Bridge, and the Saint John Highway Arch Bridge. One of the lesser known landmark bridges designed by Pratley was the Sheet Harbour Bridge (1957–1958), crossing over the East River at Sheet Harbour, Nova Scotia. On its erection, the through-steel arch structure of 465 ft span was the second longest-span highway bridge in Nova Scotia. It was replaced in 2015. Pratley was also appointed to the American committee formed to investigate the failure of the Tacoma Narrows Bridge.
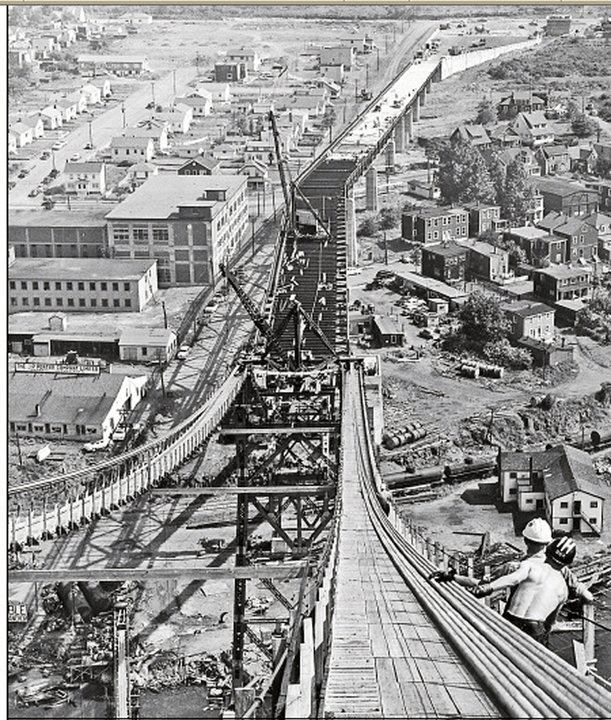
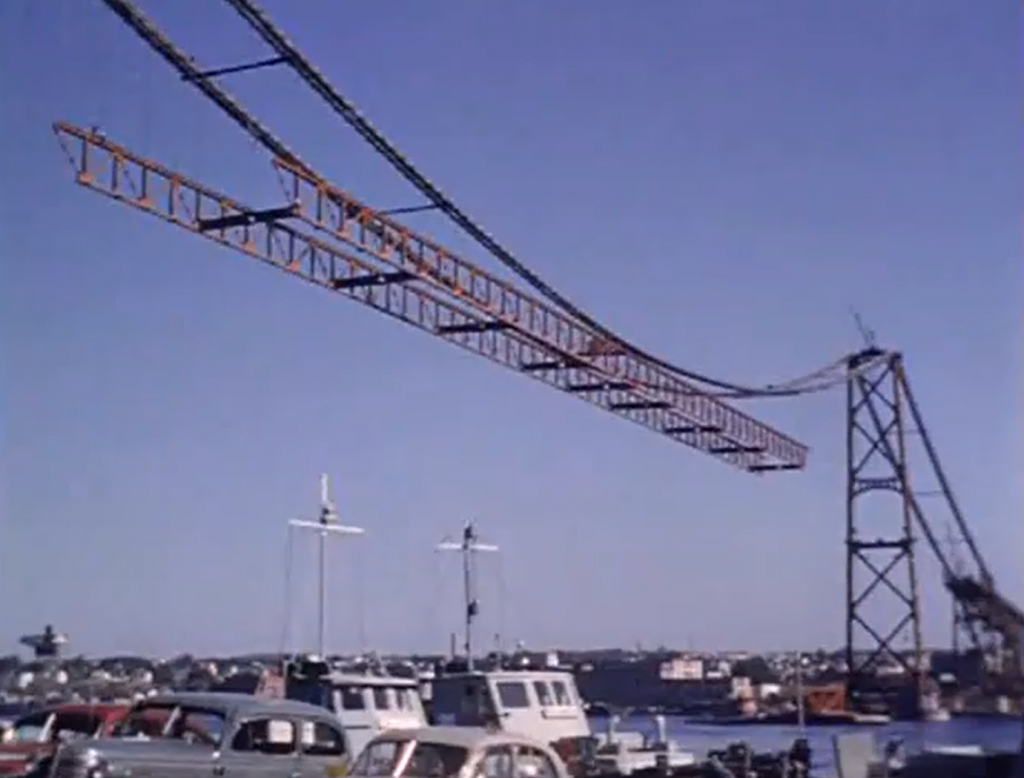
The Dominion Bridge Company itself was formed in 1896, and lasted until 1998, when it went bankrupt after purchasing the MIL Davie Shipyard. The last remaining Dominion Bridge facility is a plant in Amherst, operated by the Cherubini group, who will be doing the steel fabrication of the new pieces for the bridge. Pratley’s son Hugh was involved in the site supervision and took over the operation of the consulting firm on the death of his father in 1958. Construction on the Macdonald Bridge began in 1952, and took 3 years. During construction, 6 workers were killed.
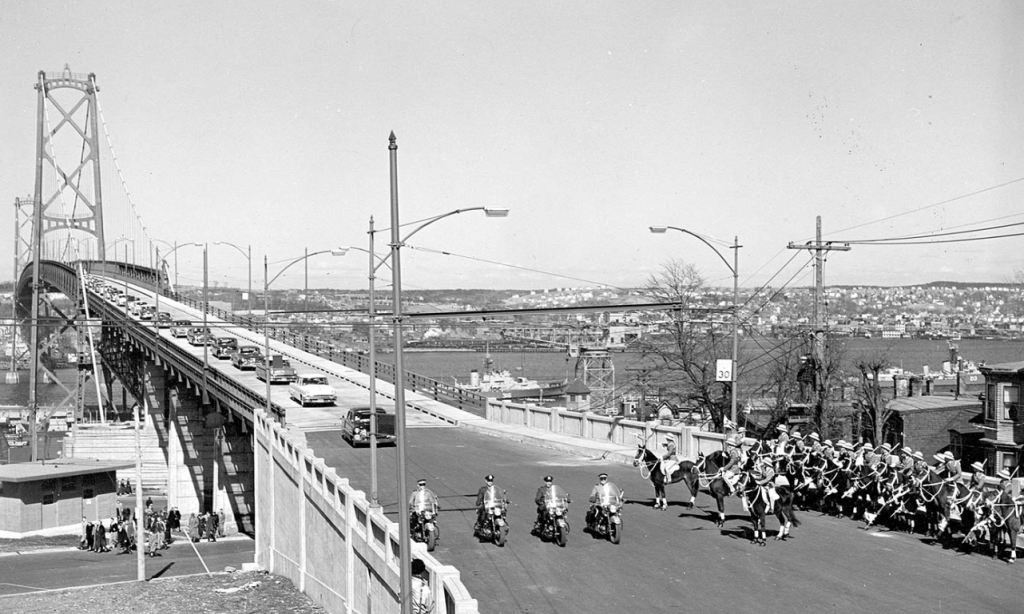
The Macdonald Bridge opened to the public on April 2, 1955.
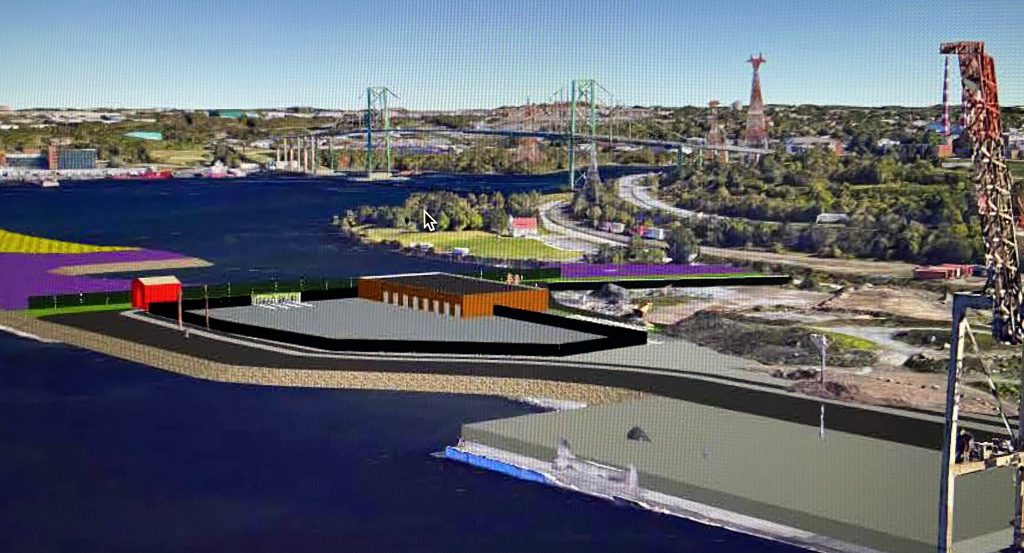
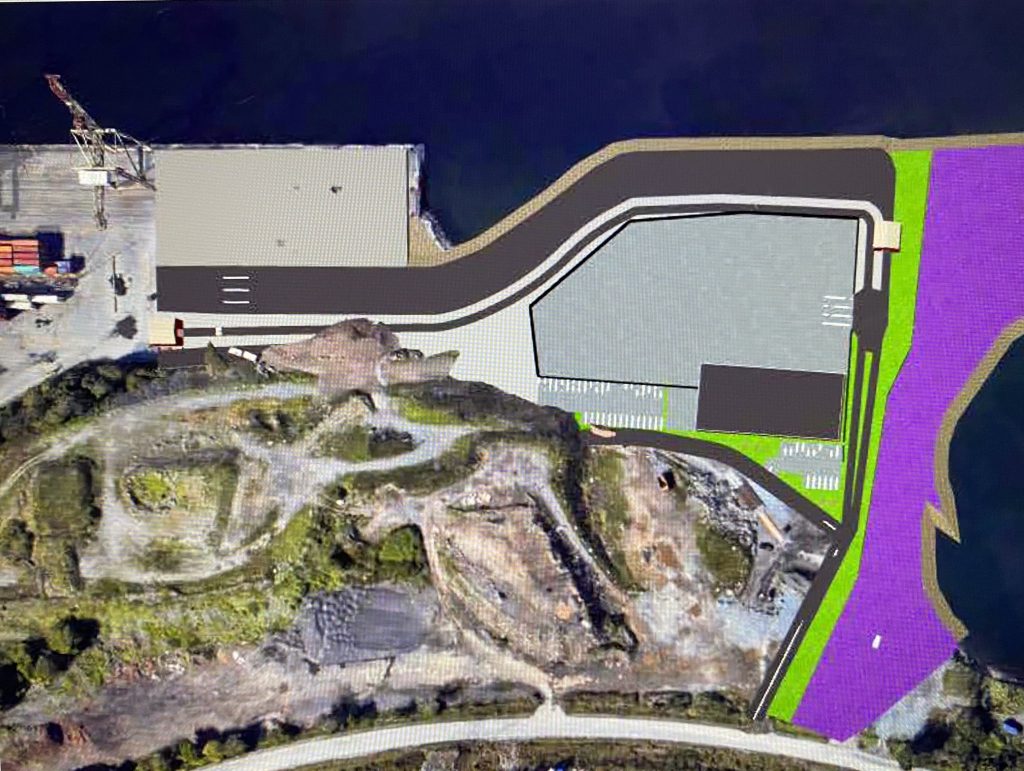
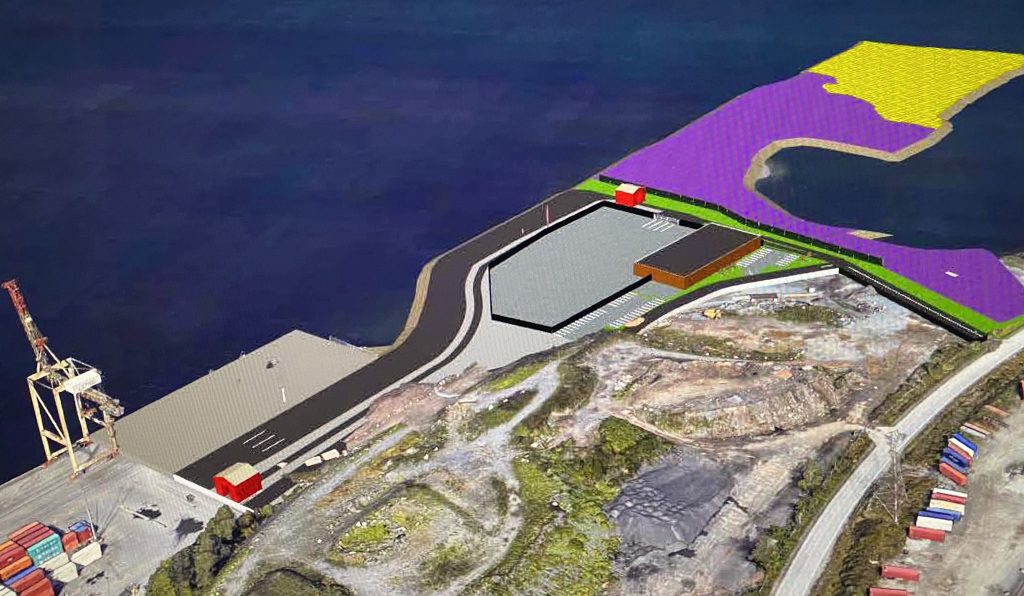
Thanks to a presentation posted on the cities public consultation website Shape Your city, we now know what the new truck access to Fairview Cove will look like.
This access will be used to handle the majority of container traffic bound for both the Fairview Cove and PSA halifax terminal in the south end. the new access is off Africville road, in the general area where the dump trucks now access the infill area. Containers bound for PSA Halifax will be loaded on rail cars for transport to the other terminal.
Besides the truck access, the facility will feature a new inspection facility, presumably for use by CBSA to inspect suspect shipments before being forwarded on. that facility will include a shed, and a fenced in yard.
There is no word yet on the changes to the Windsor street exchange to improve access to the site, however the moving of the truck access will free up land making more space available for whatever the final result is.

