
Over on Twitter i have been participating in the #30DayMapChallenge. the challenge consists of 30 themes, with the idea to produce a map for each one. This post summarizes the challenge, and includes information on the data sets used. A full explanation of the themes can be found on github.
Common Data Sources
these are some common data sets that I frequently come back to.
HRM Building Outlines – polygons representing building footprints
HRM Street Centerlines – centerlines of streets, with names
HRM Active travelways – sidewalks, paths and trails
HRM Lidar DEM 1m – 1m resolution lidar data from 2017.
Canadian Boundaries – Canada land forms and provinces.
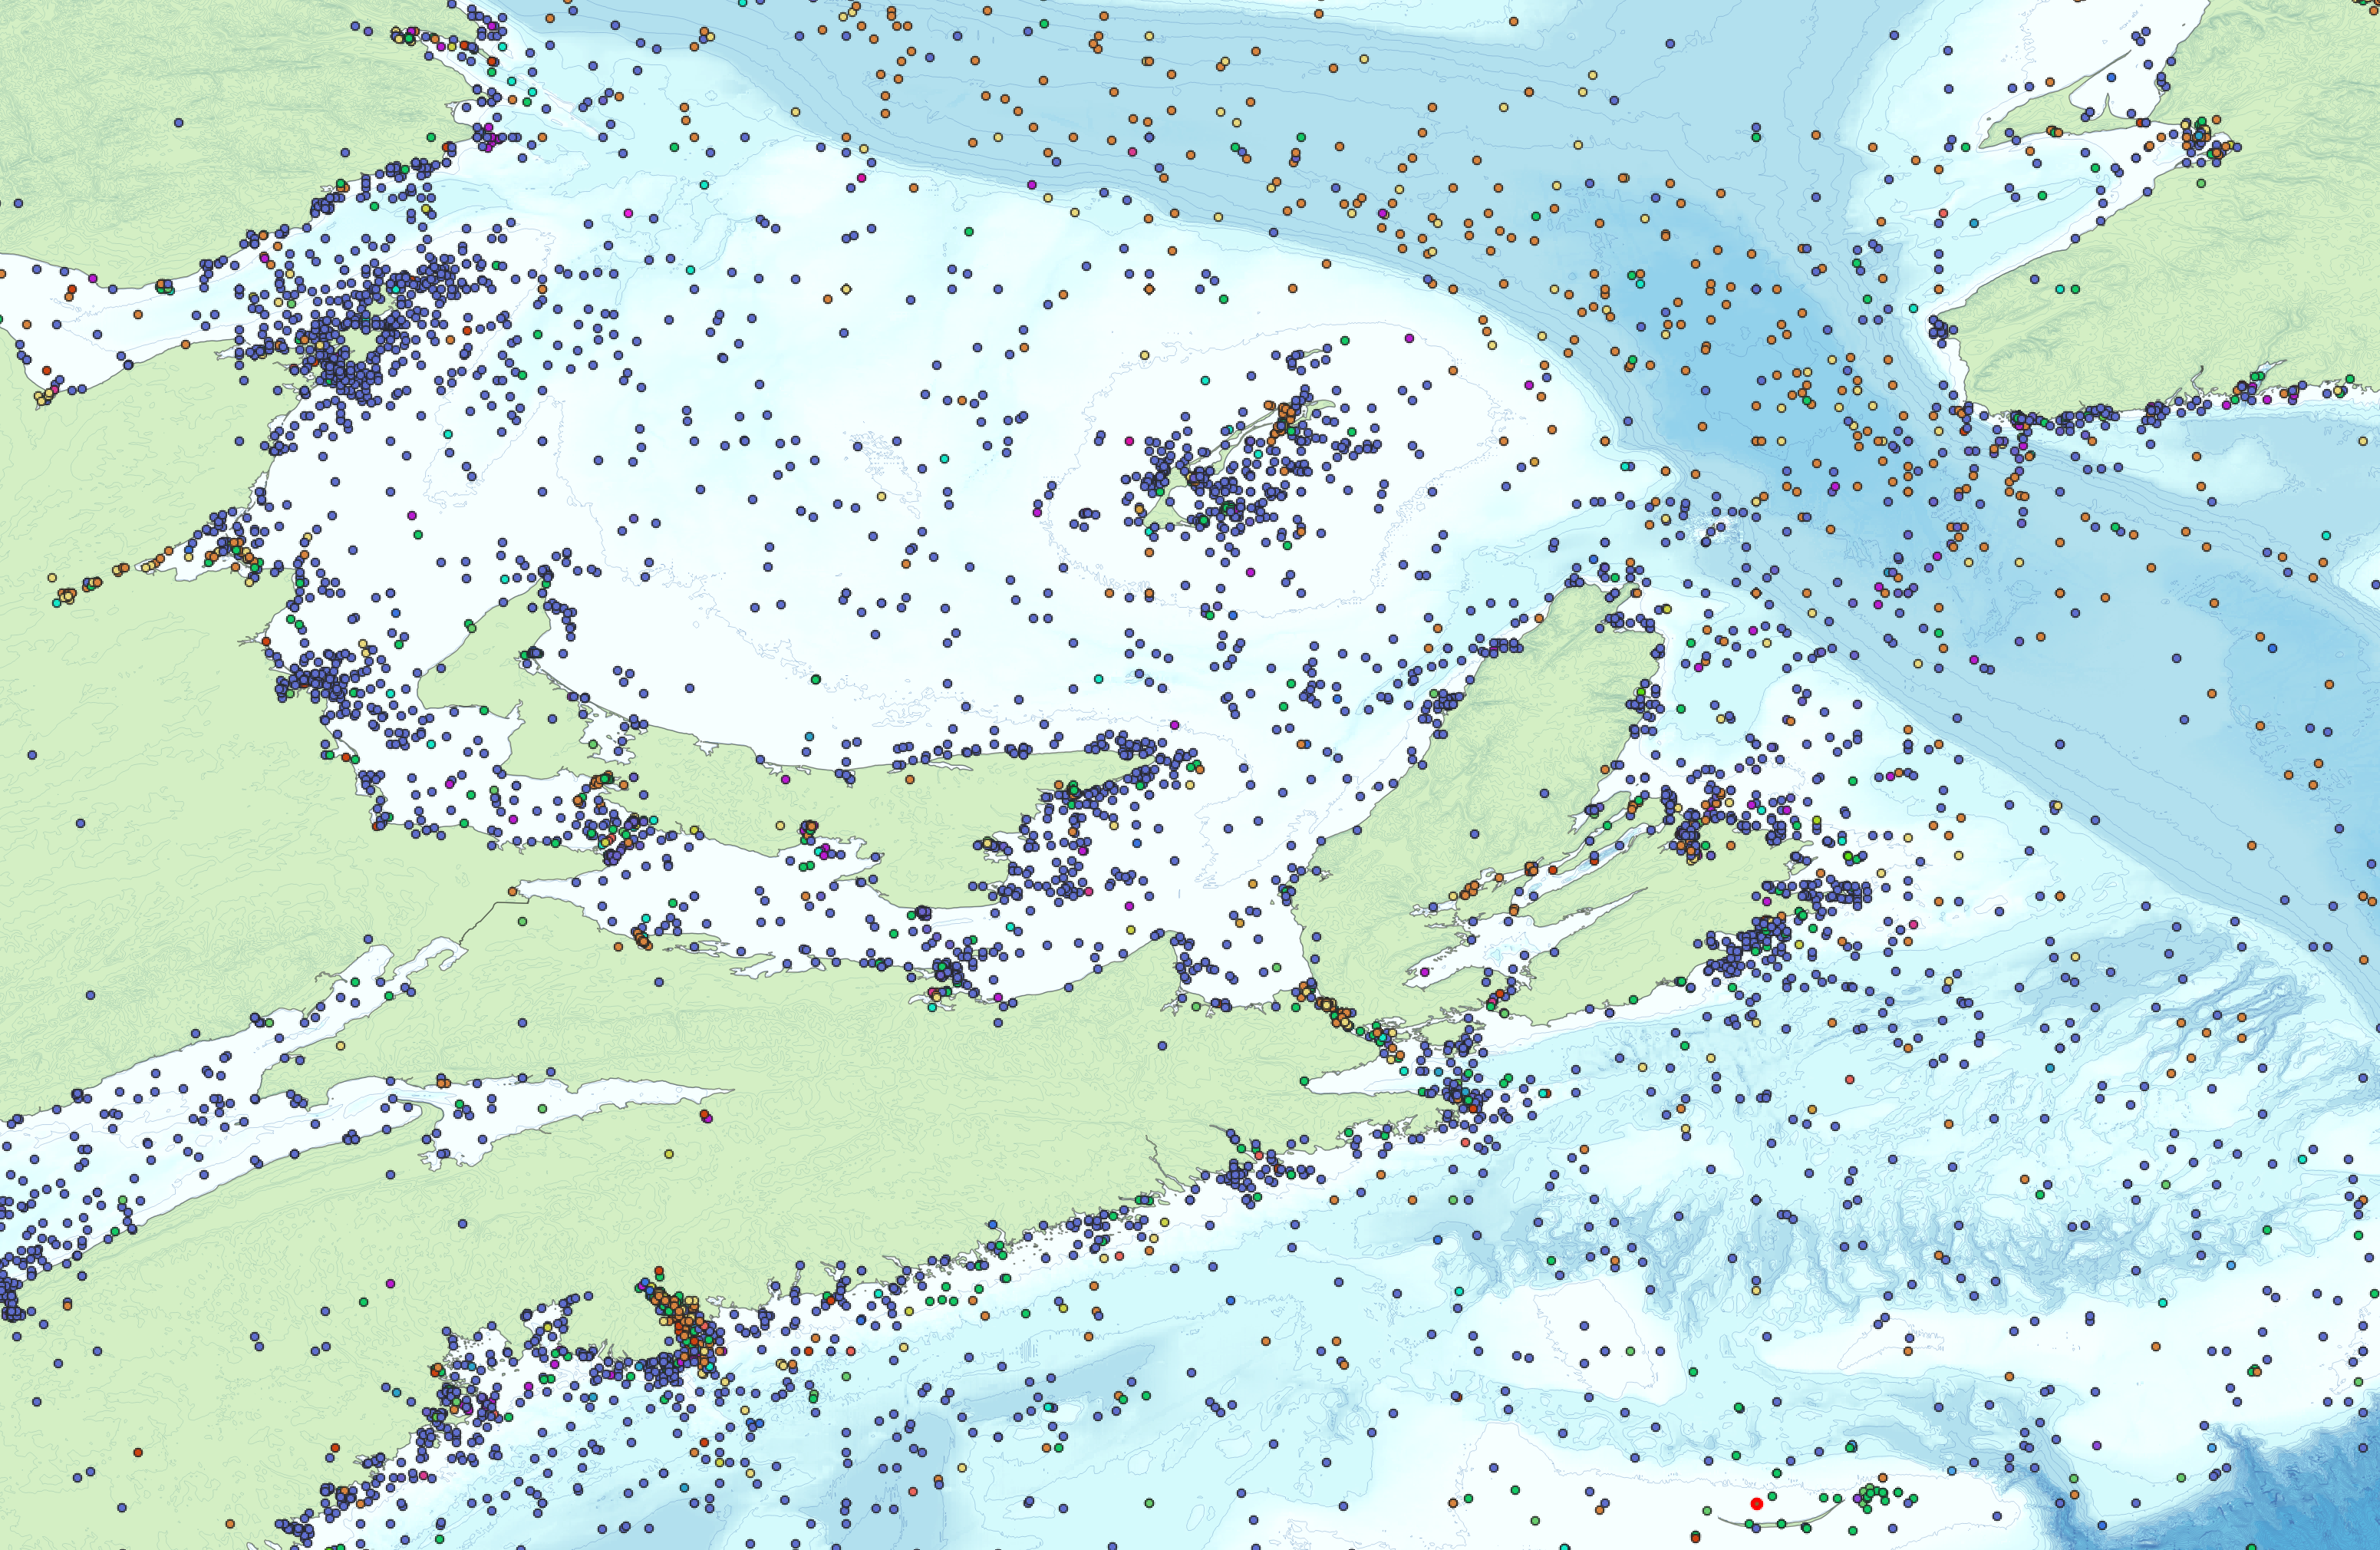
Day 1 – Points
the First 3 days of the challenge focus on the 3 kinds of Vector GIS Data, Points, Lines and Polygons. Points maps marine occurrences since 1975 reported to the Transportation safety board, and maintained within its MARSIS database. Bathemtry is from GEBCO
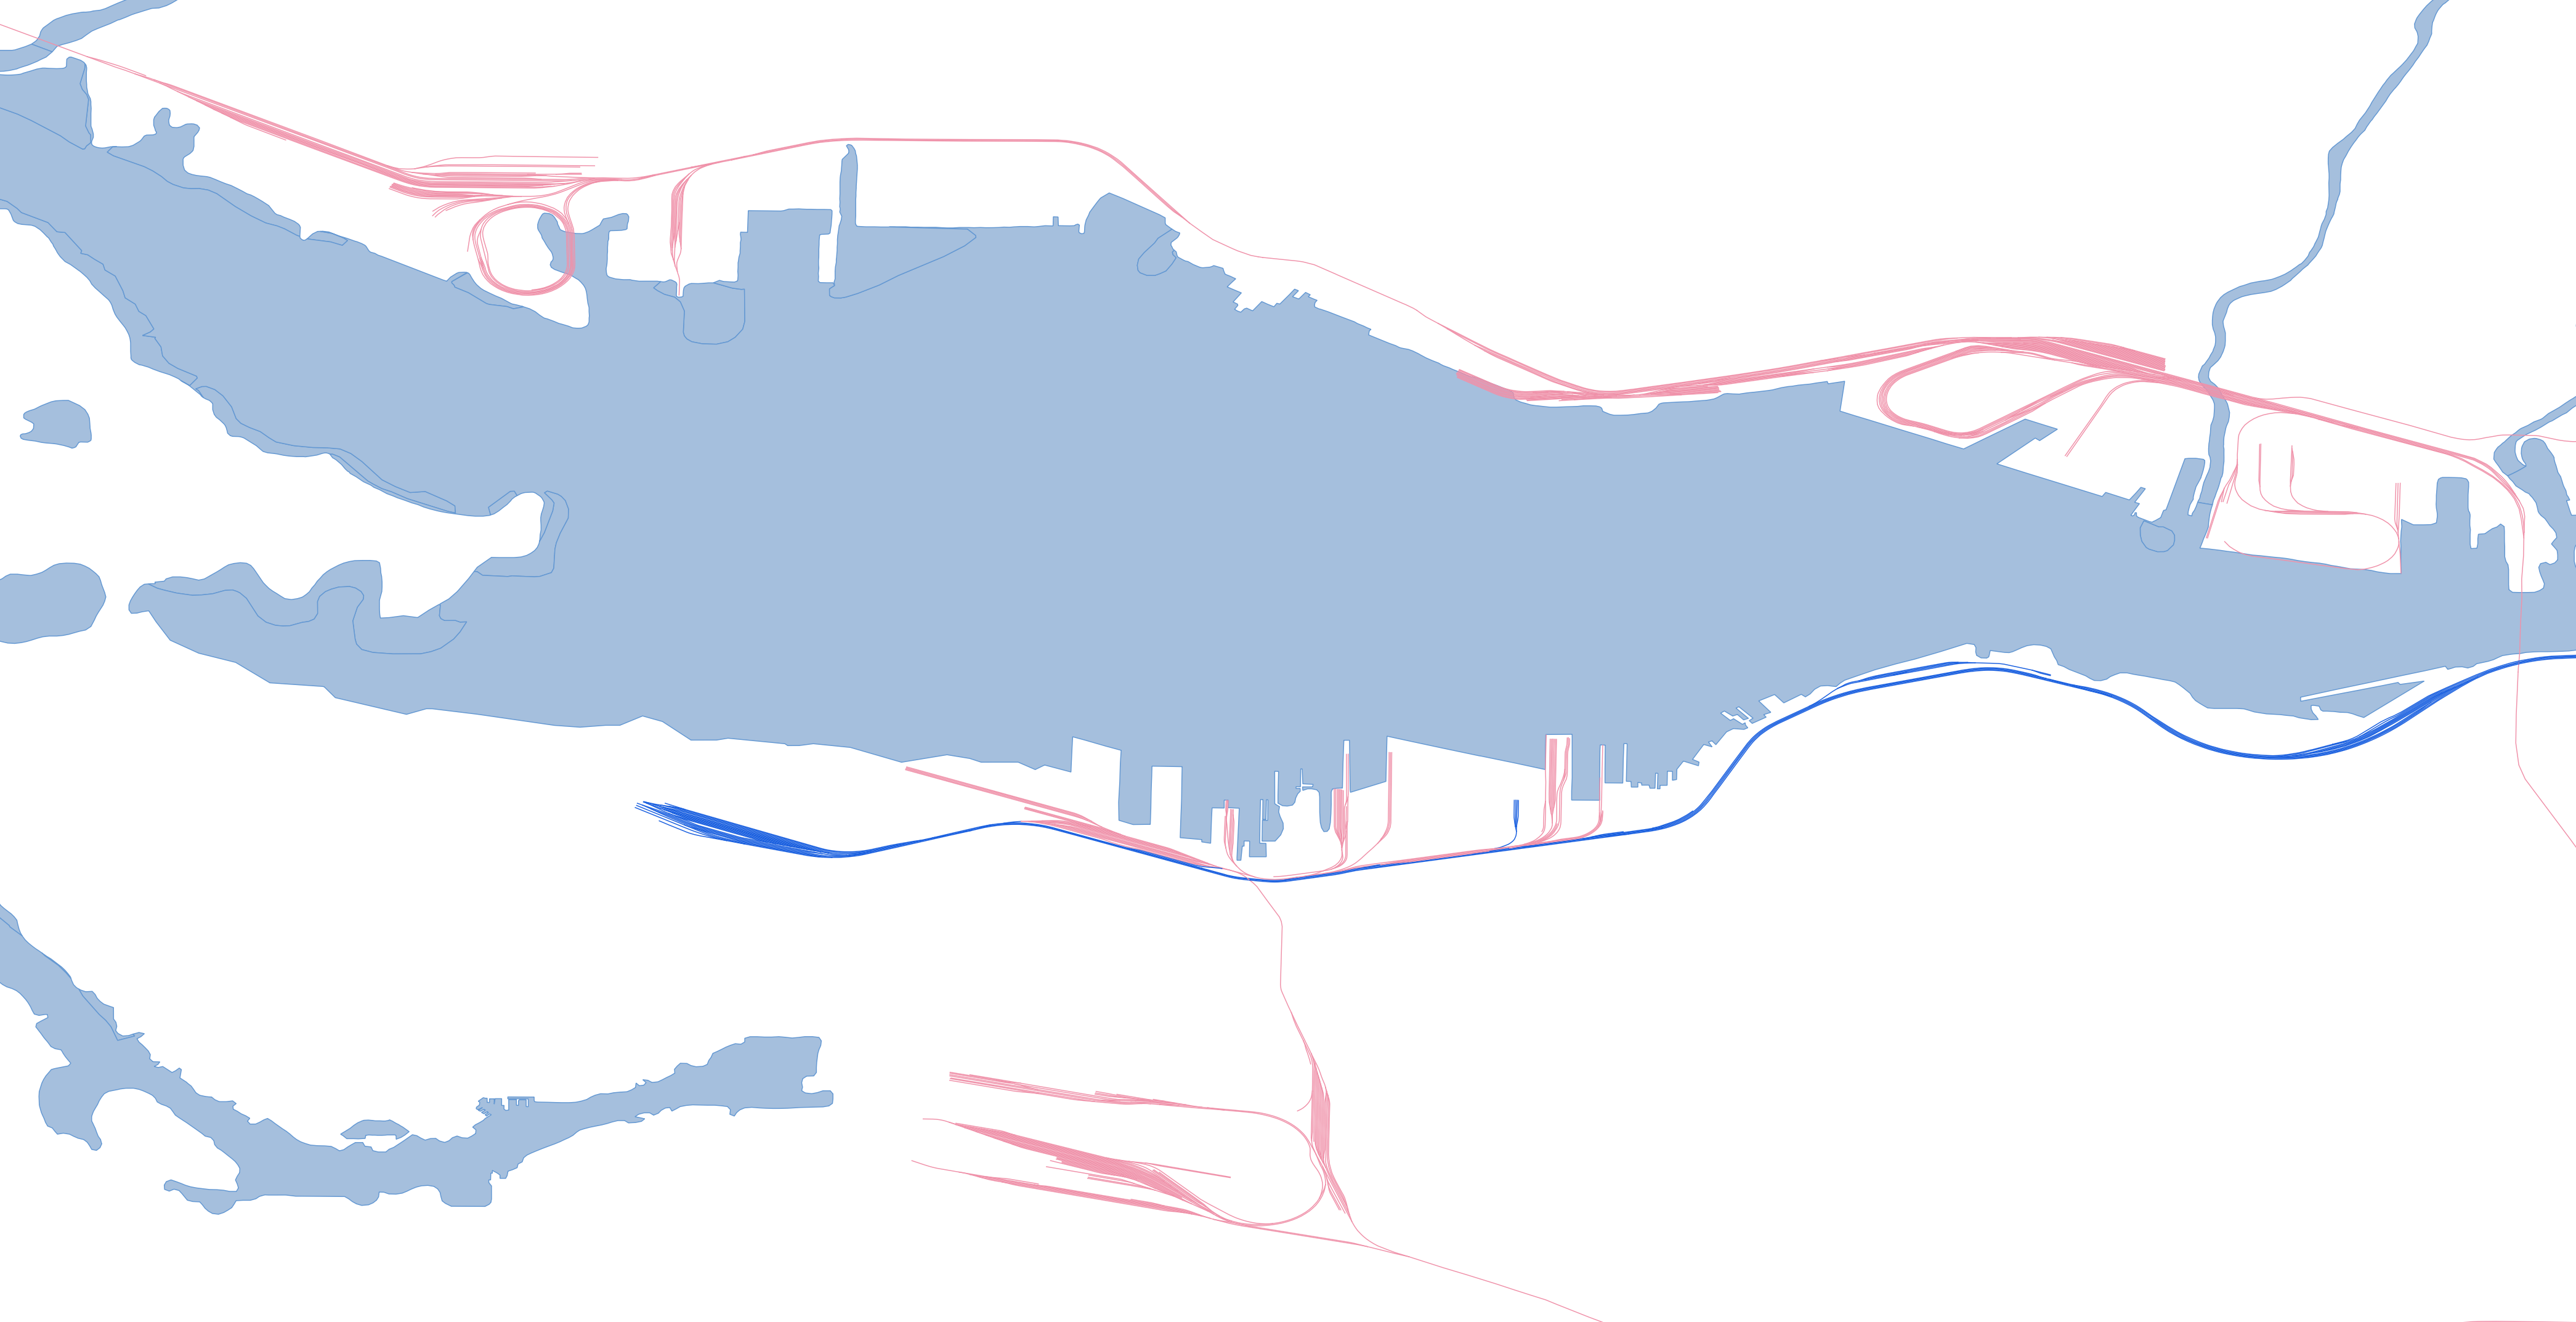
Day 2 – Lines
Lines come from the Canvec National Railway Network, and depict CN and CP rail lines around Vancouver harbour.
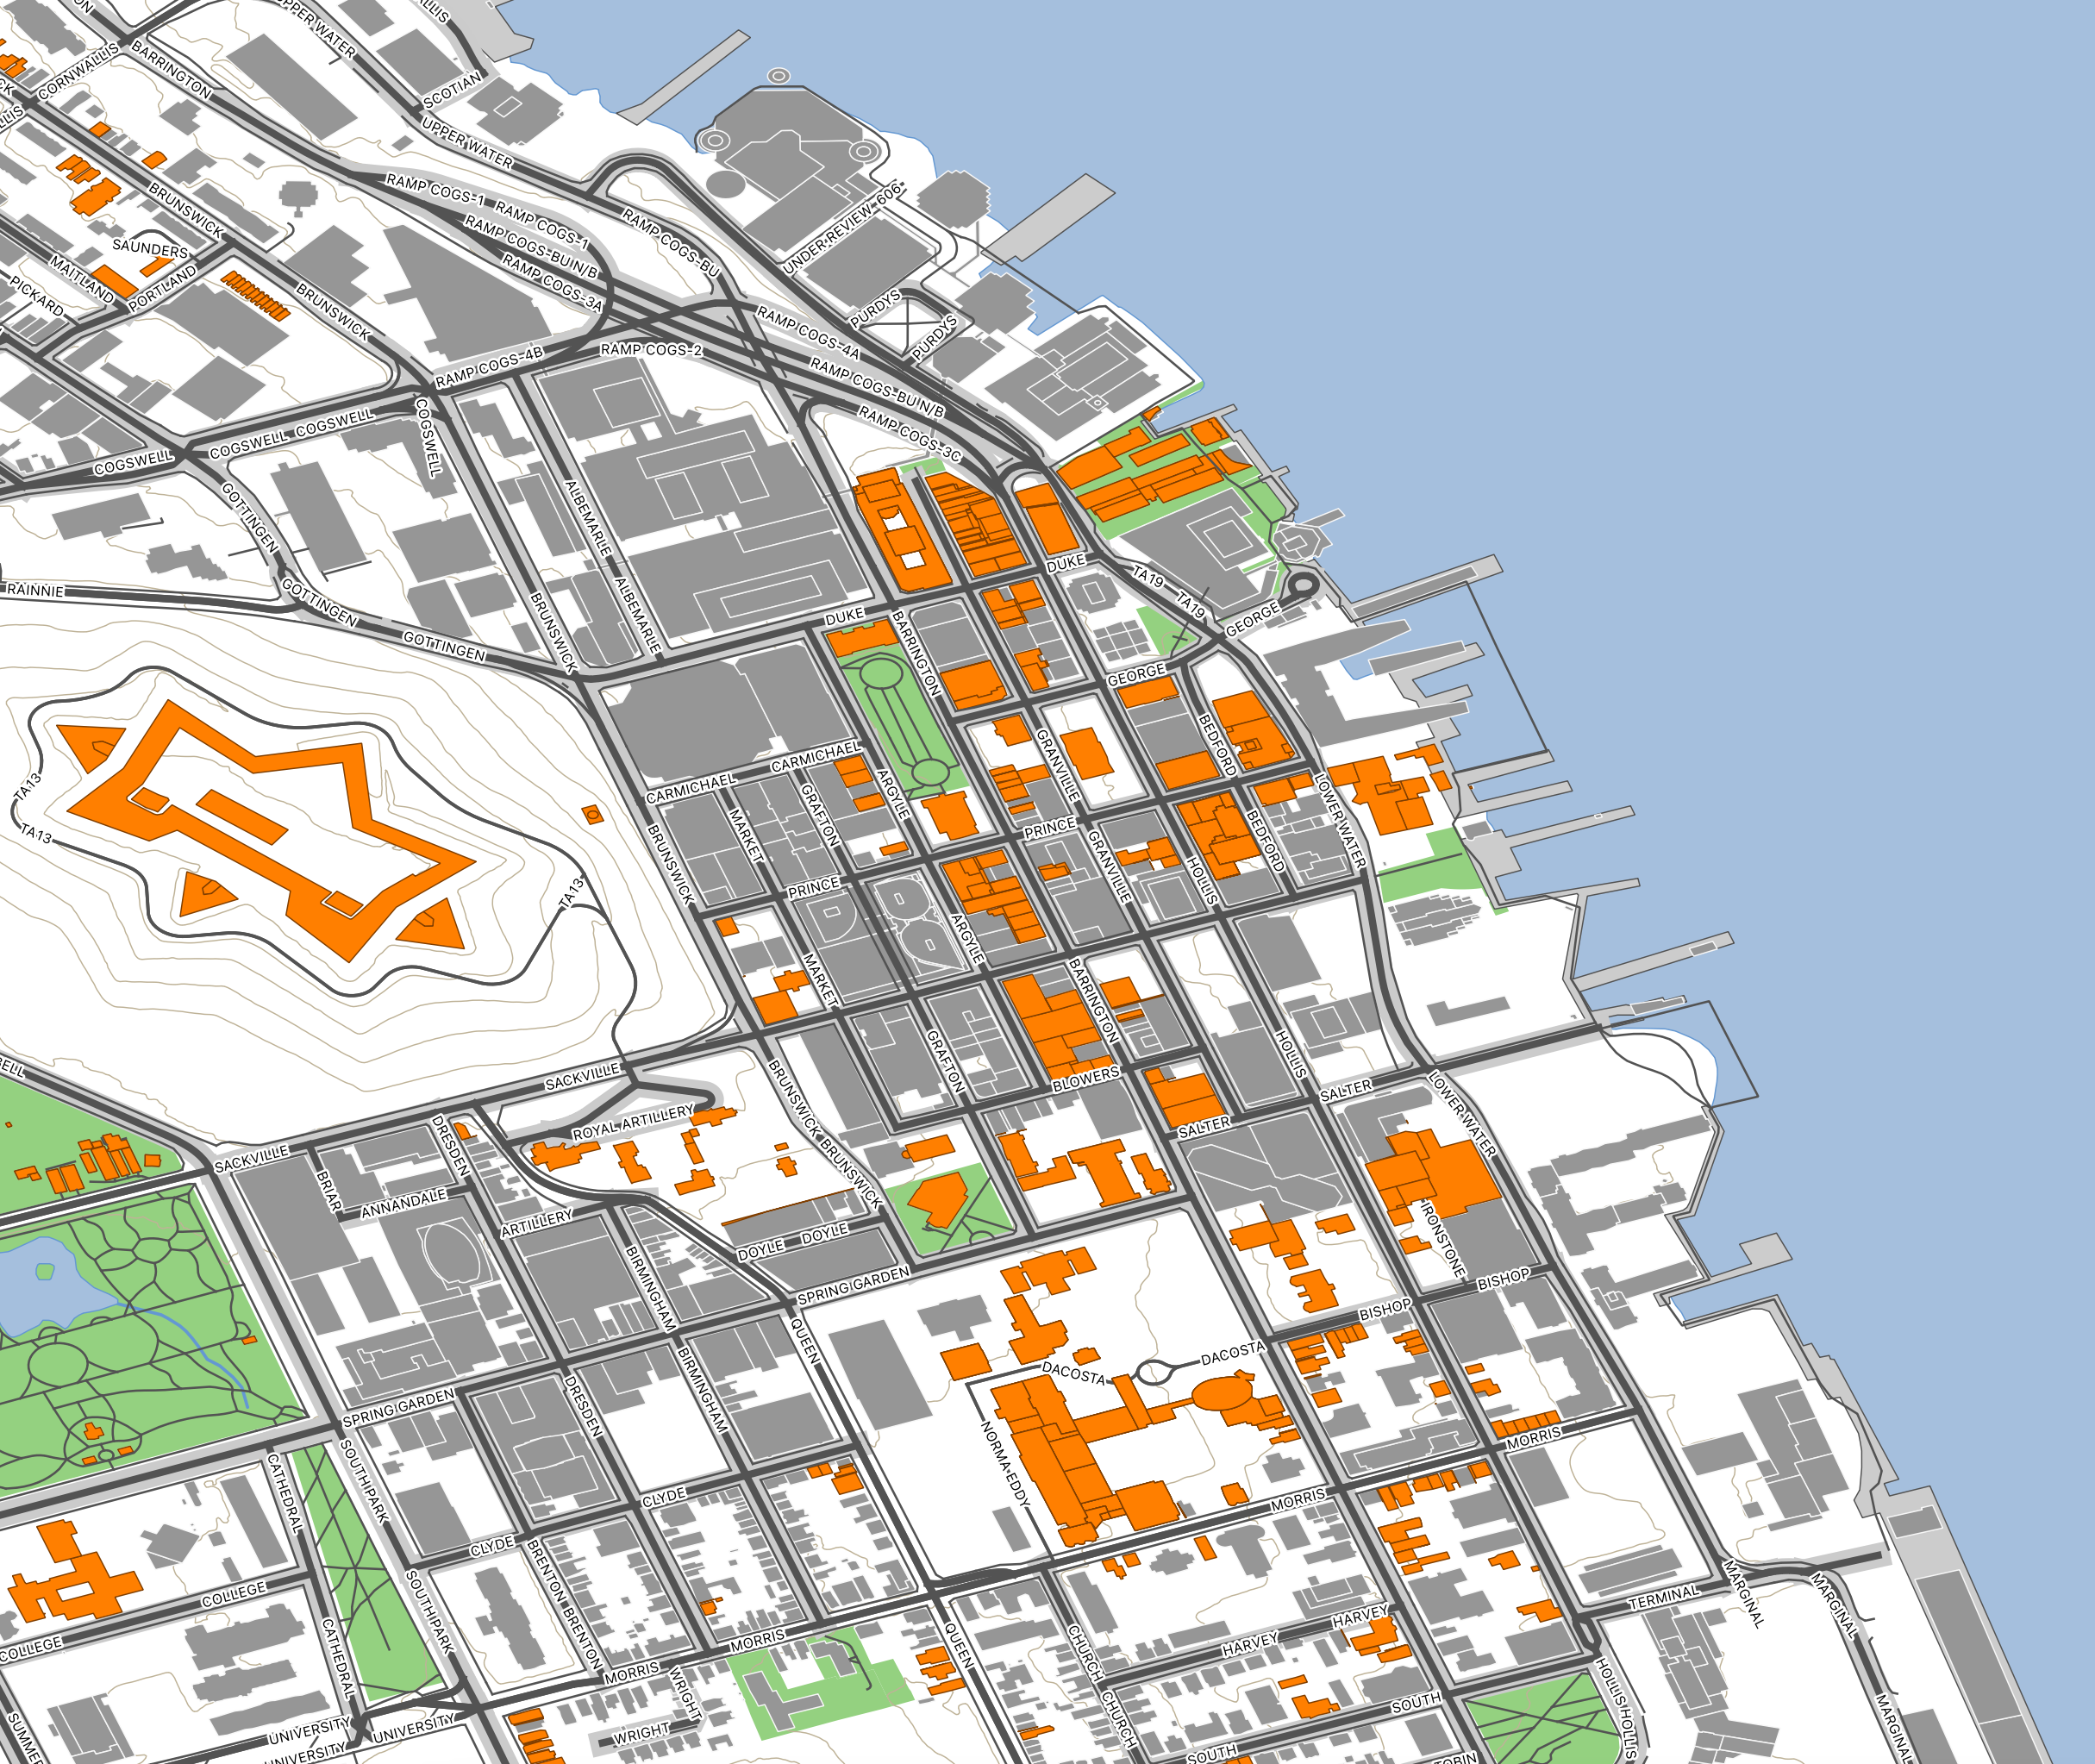
Day 3 – Polygons
i used a collection of data from Halifax Open data to extract the building footprints form the heritage property data set. Also used are the cities 5m contour, road network, and parks and active travel ways data sets.
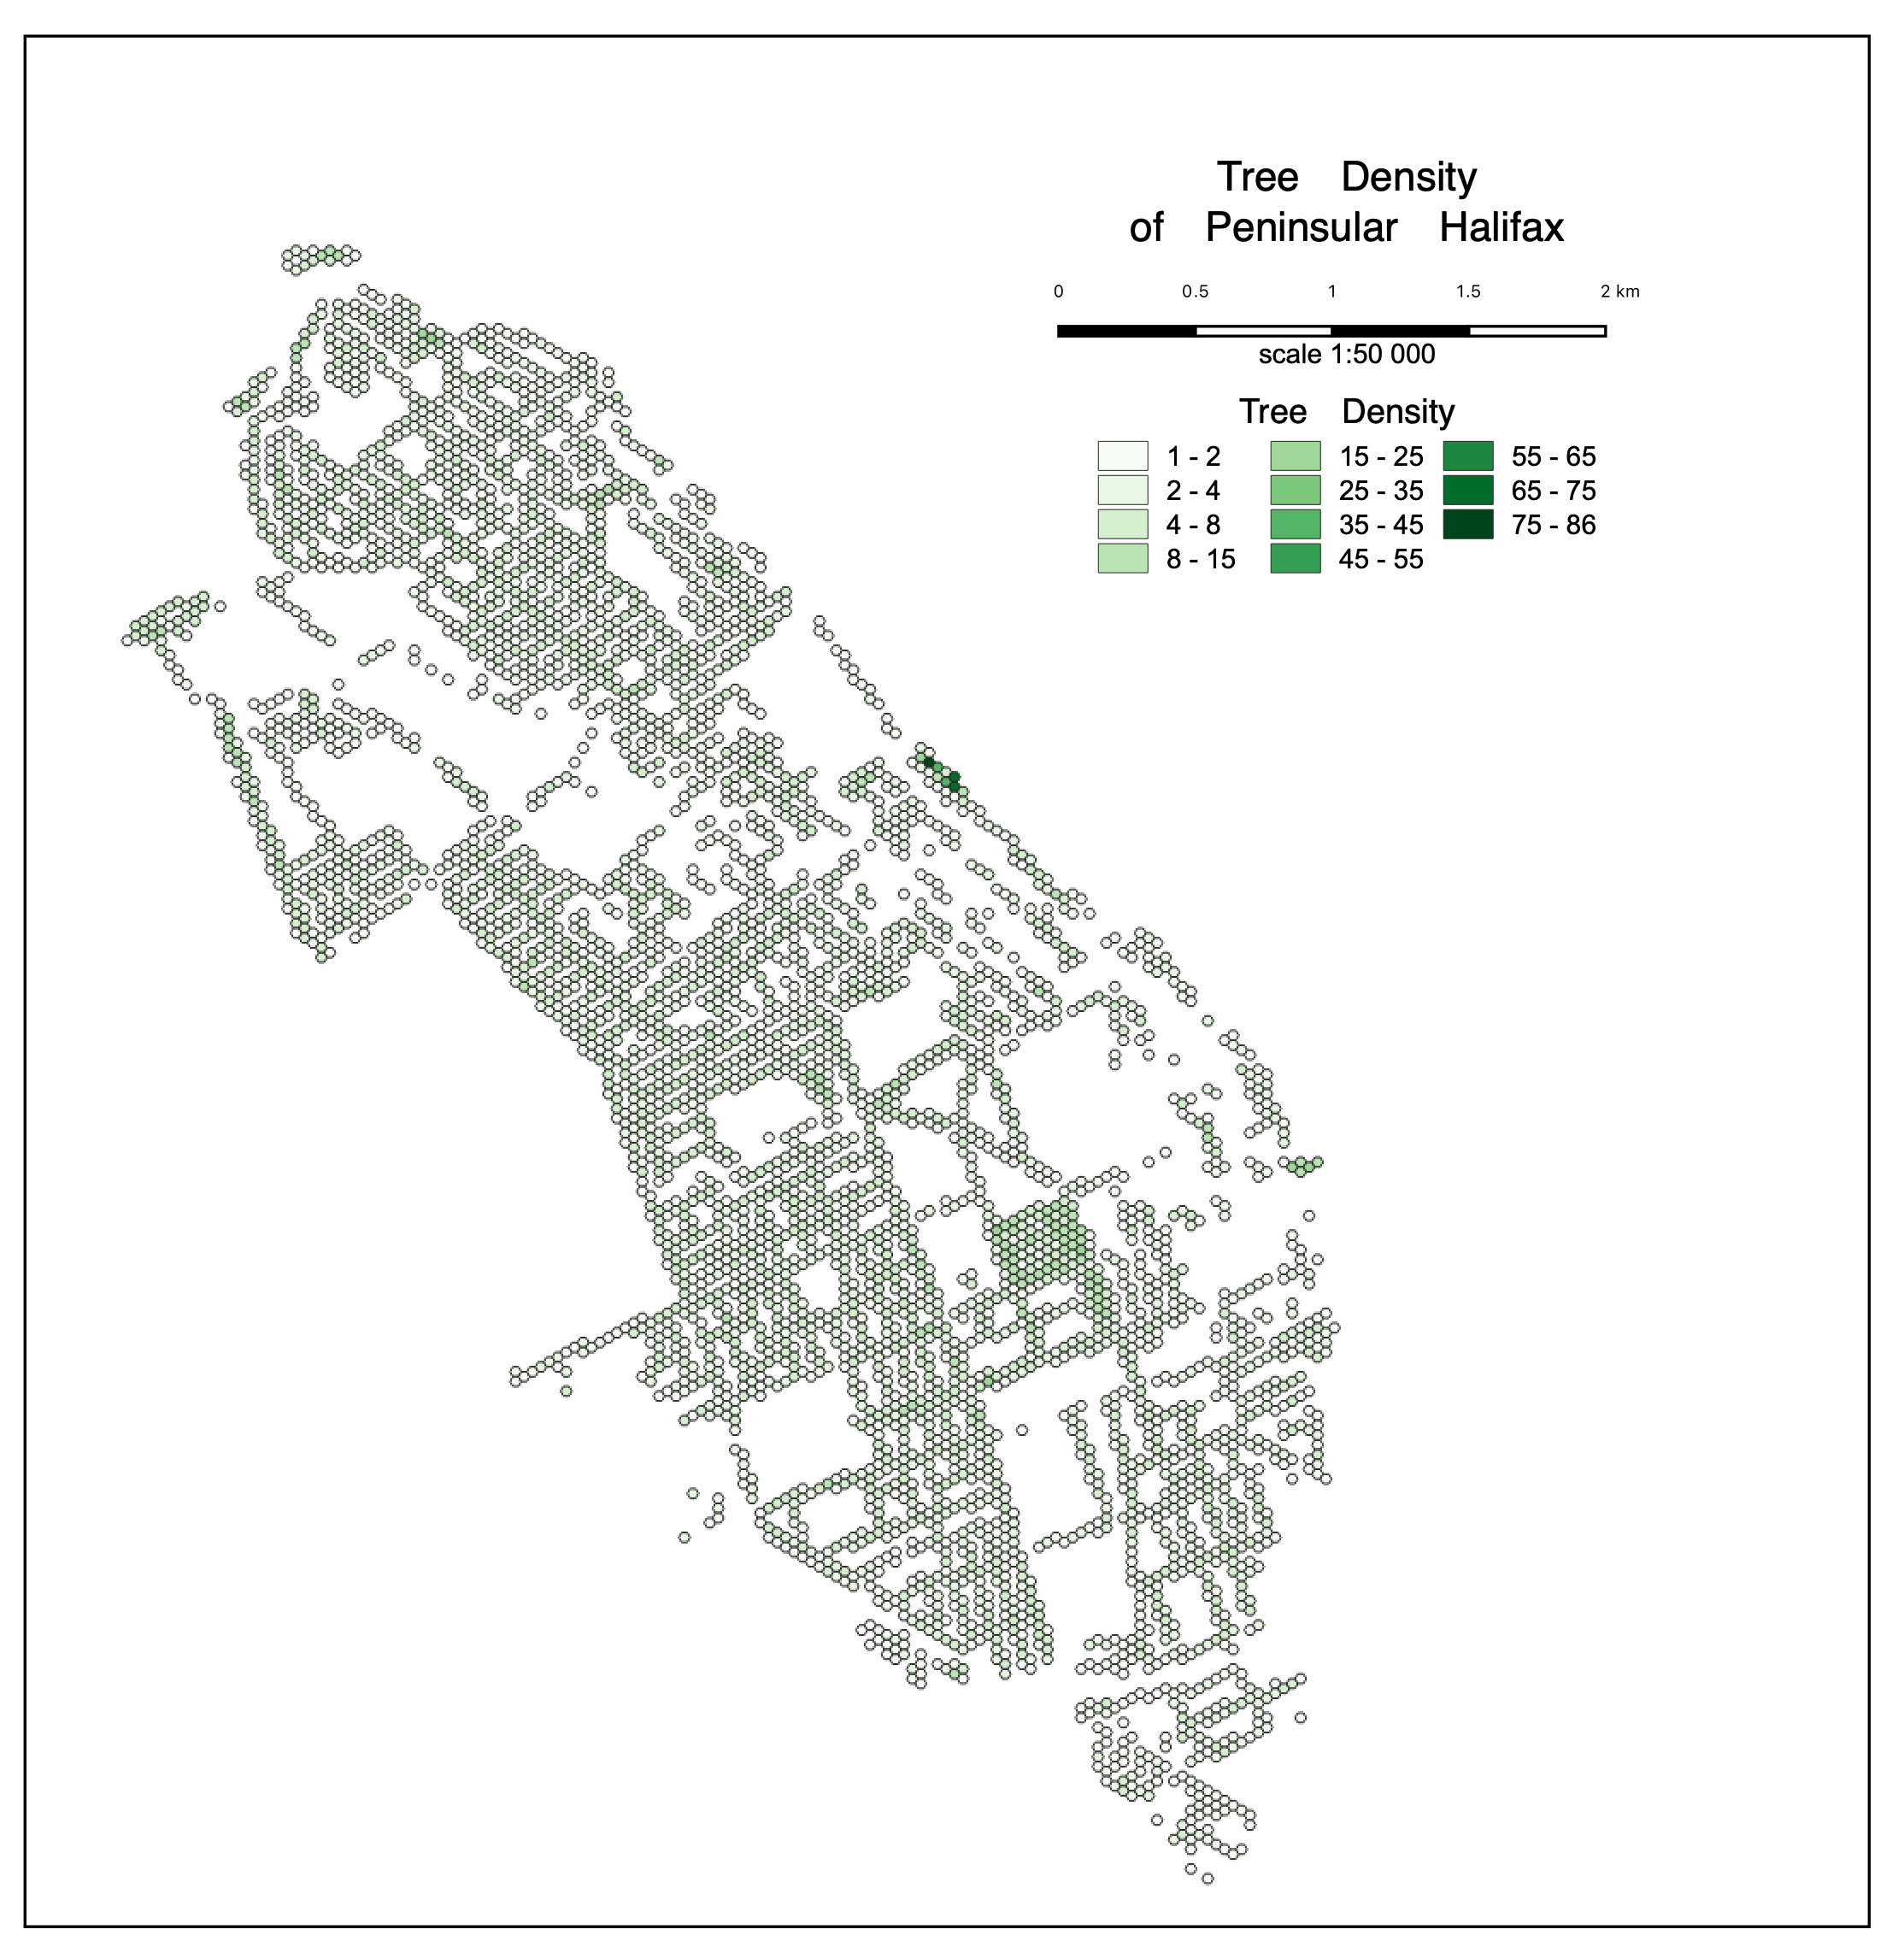
Day 4 – Hexagons
hexagons make a cool unit for showing density. the city has street tree point data available, so i mapped density of street trees per 50m hexagon.
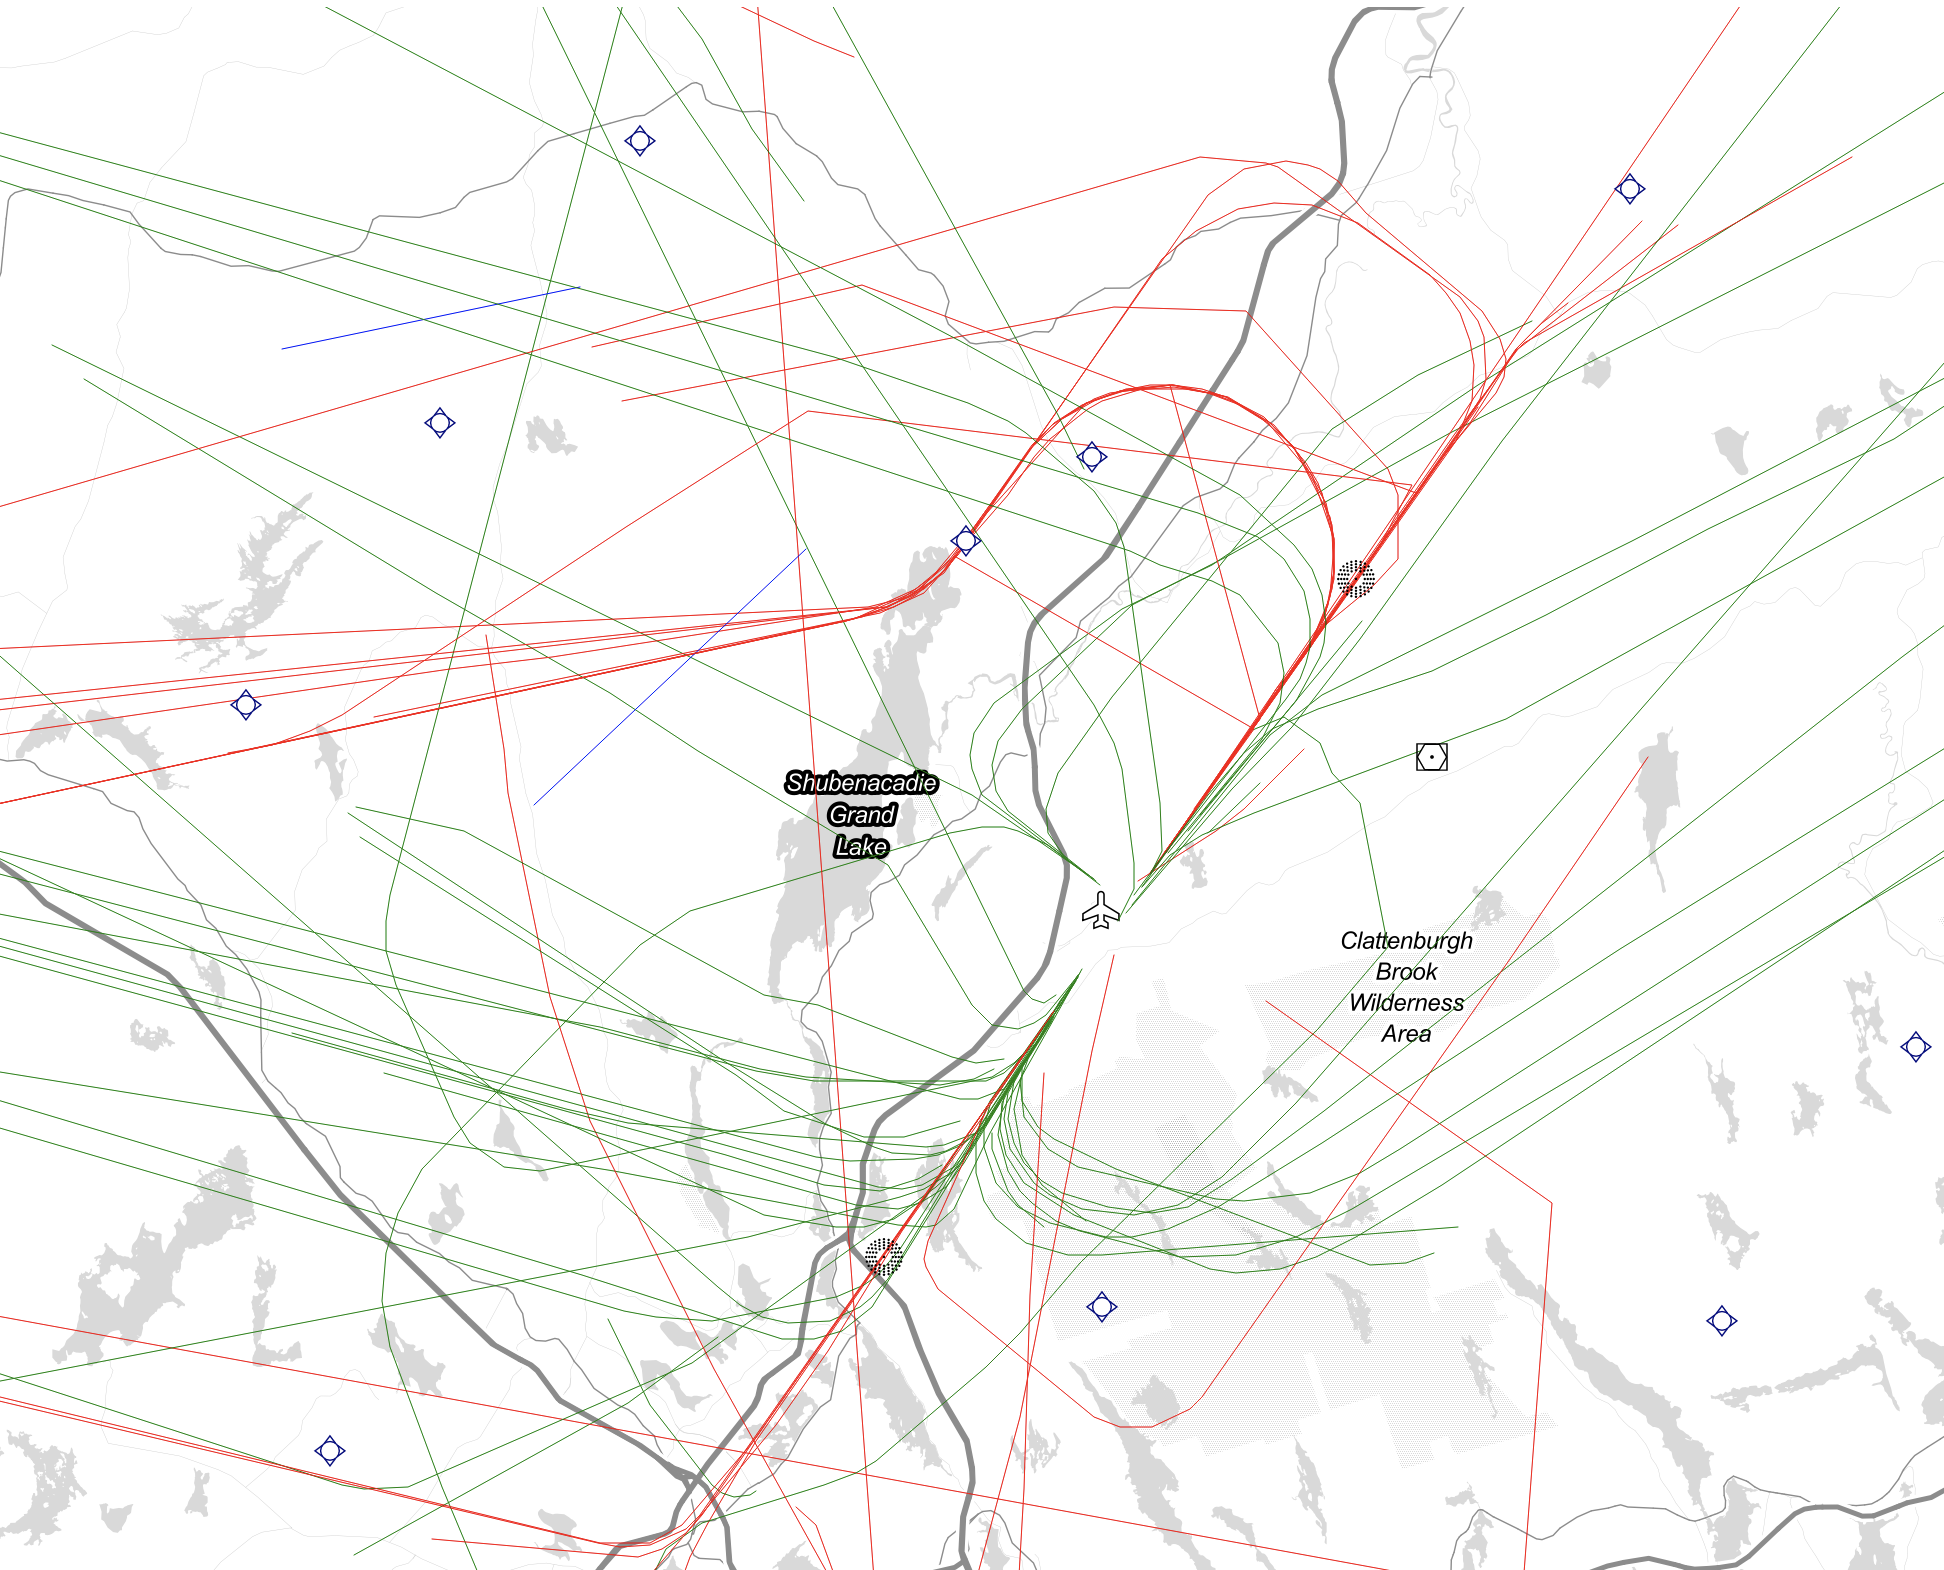
Day 5 – Open Street Map
using leaflet.js, i apply aircraft tracks picked up from my adsb receiver to an open street map basemap. The goal was to use OSM Data. done.
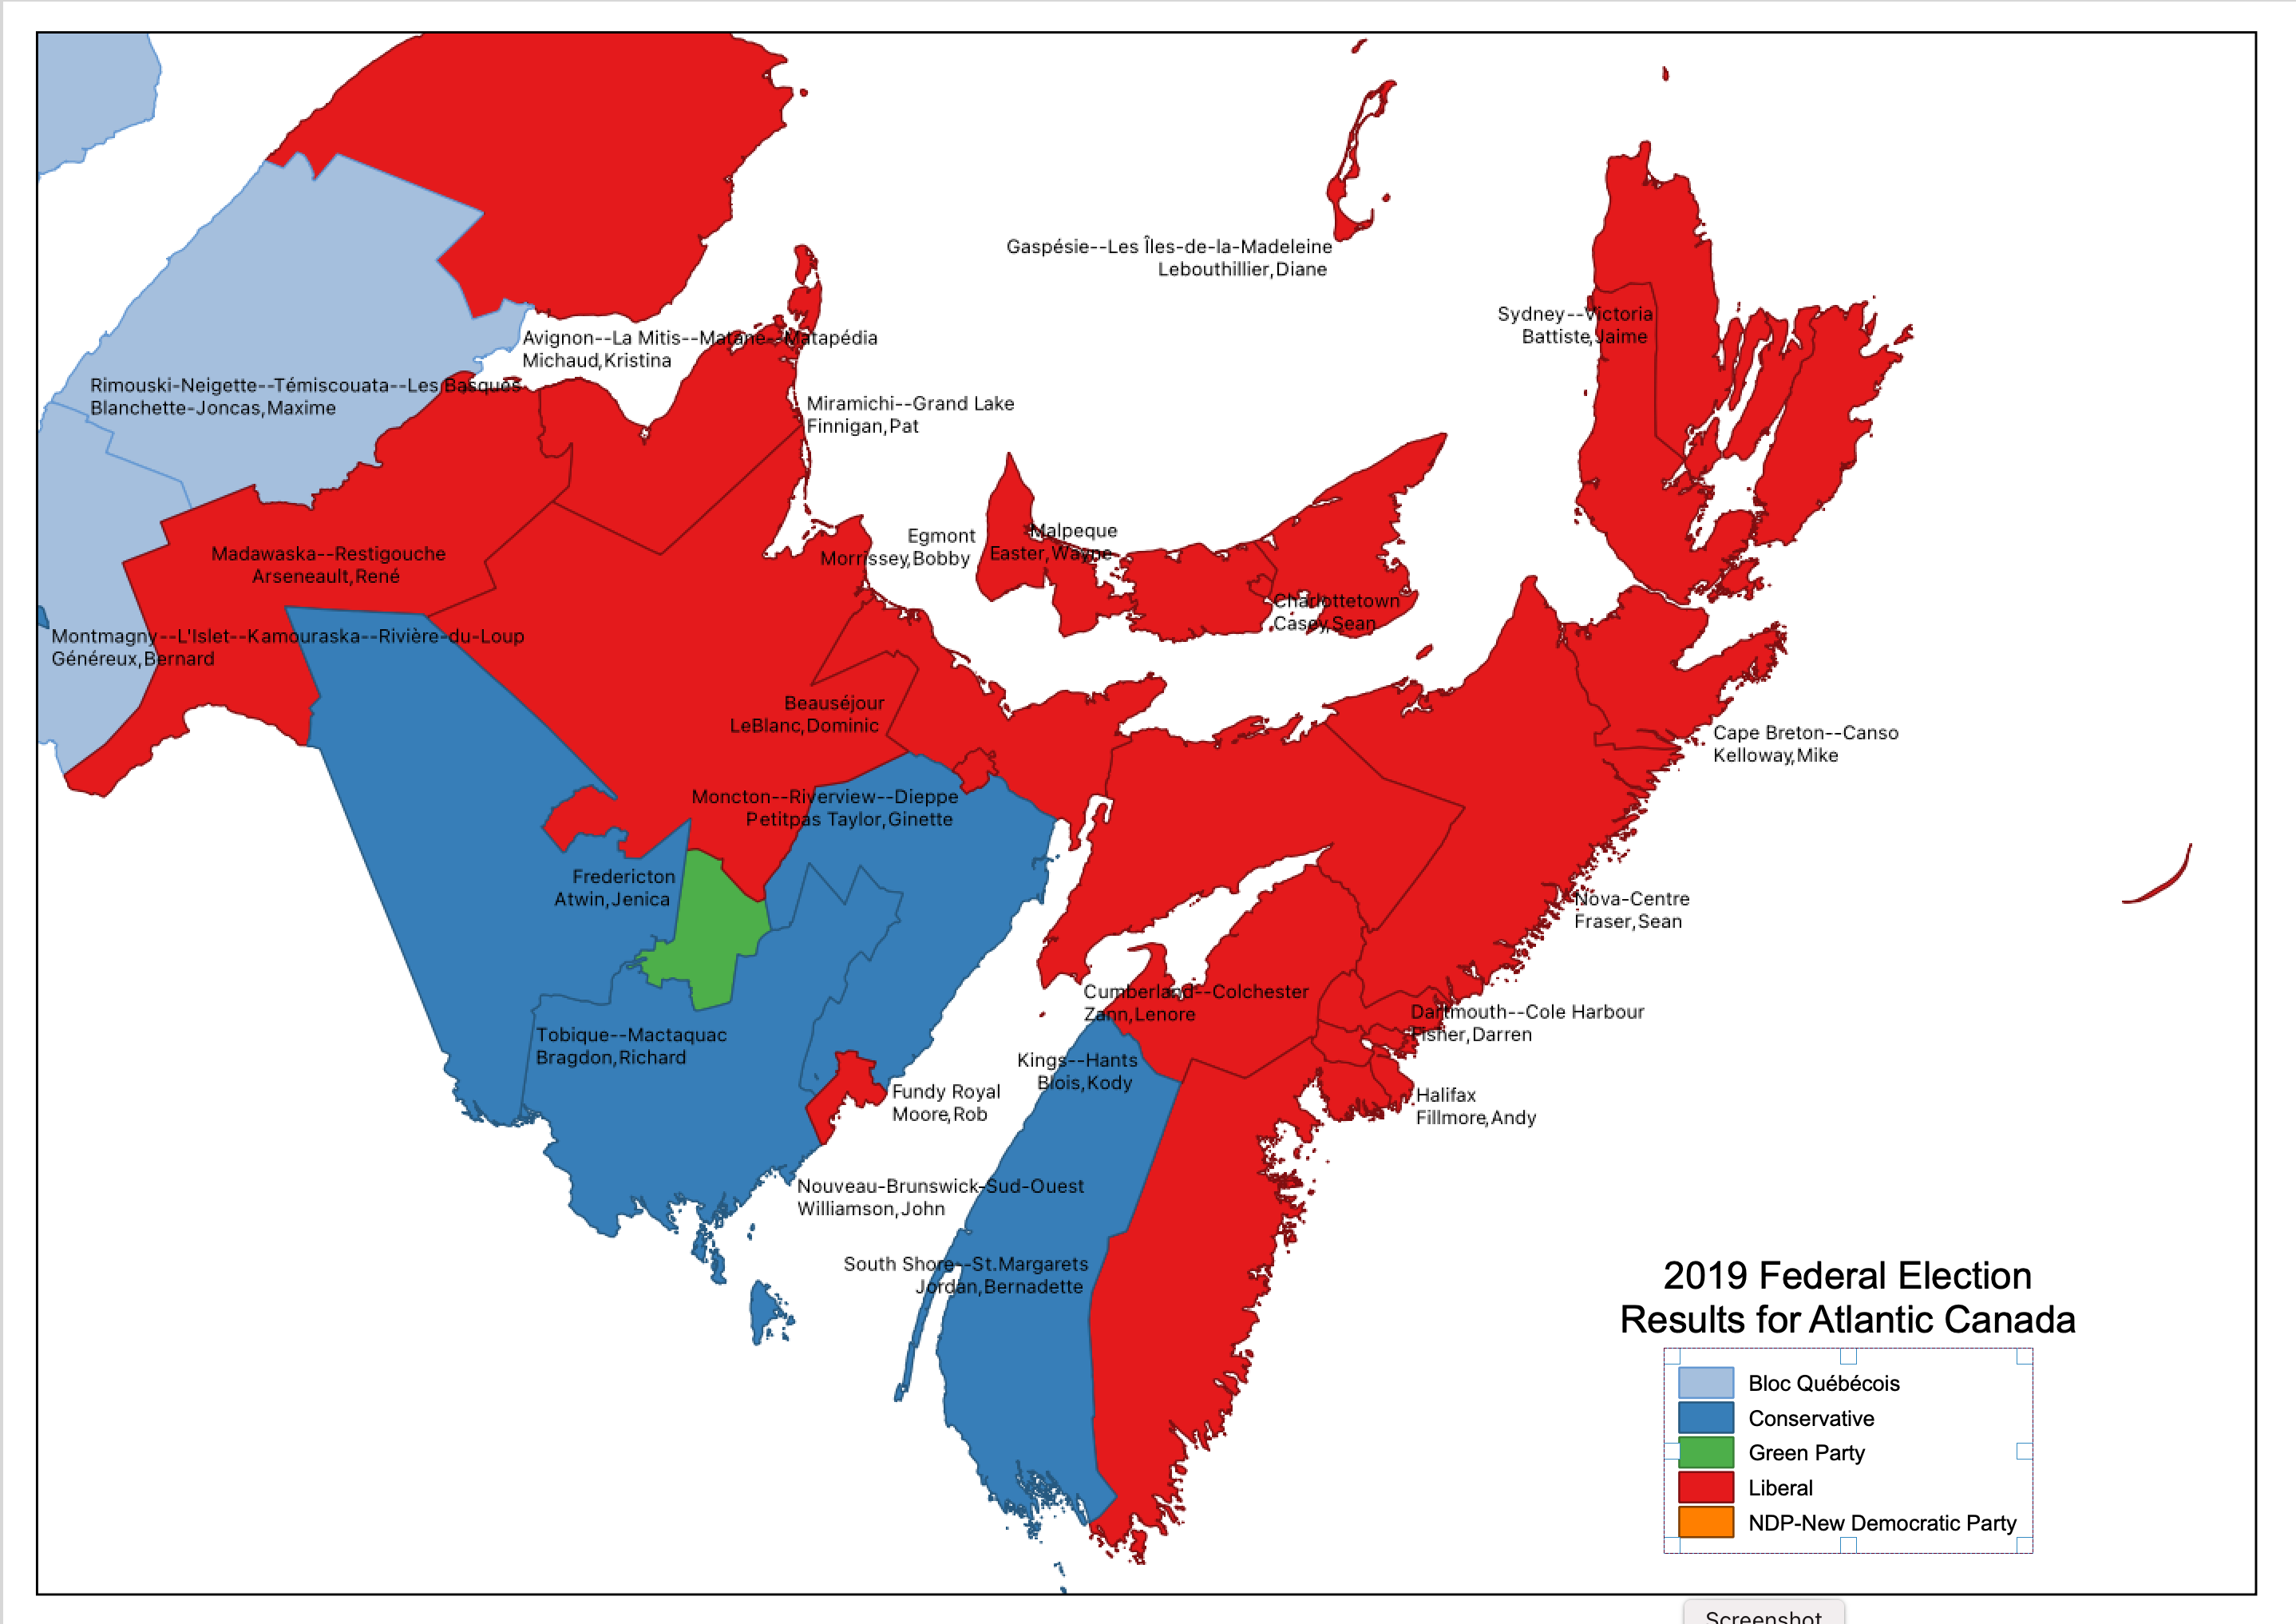
Day 6 – Red
2019 Election results showing a strong liberal win. Data from elections Canada, Results merged with federal electoral districts
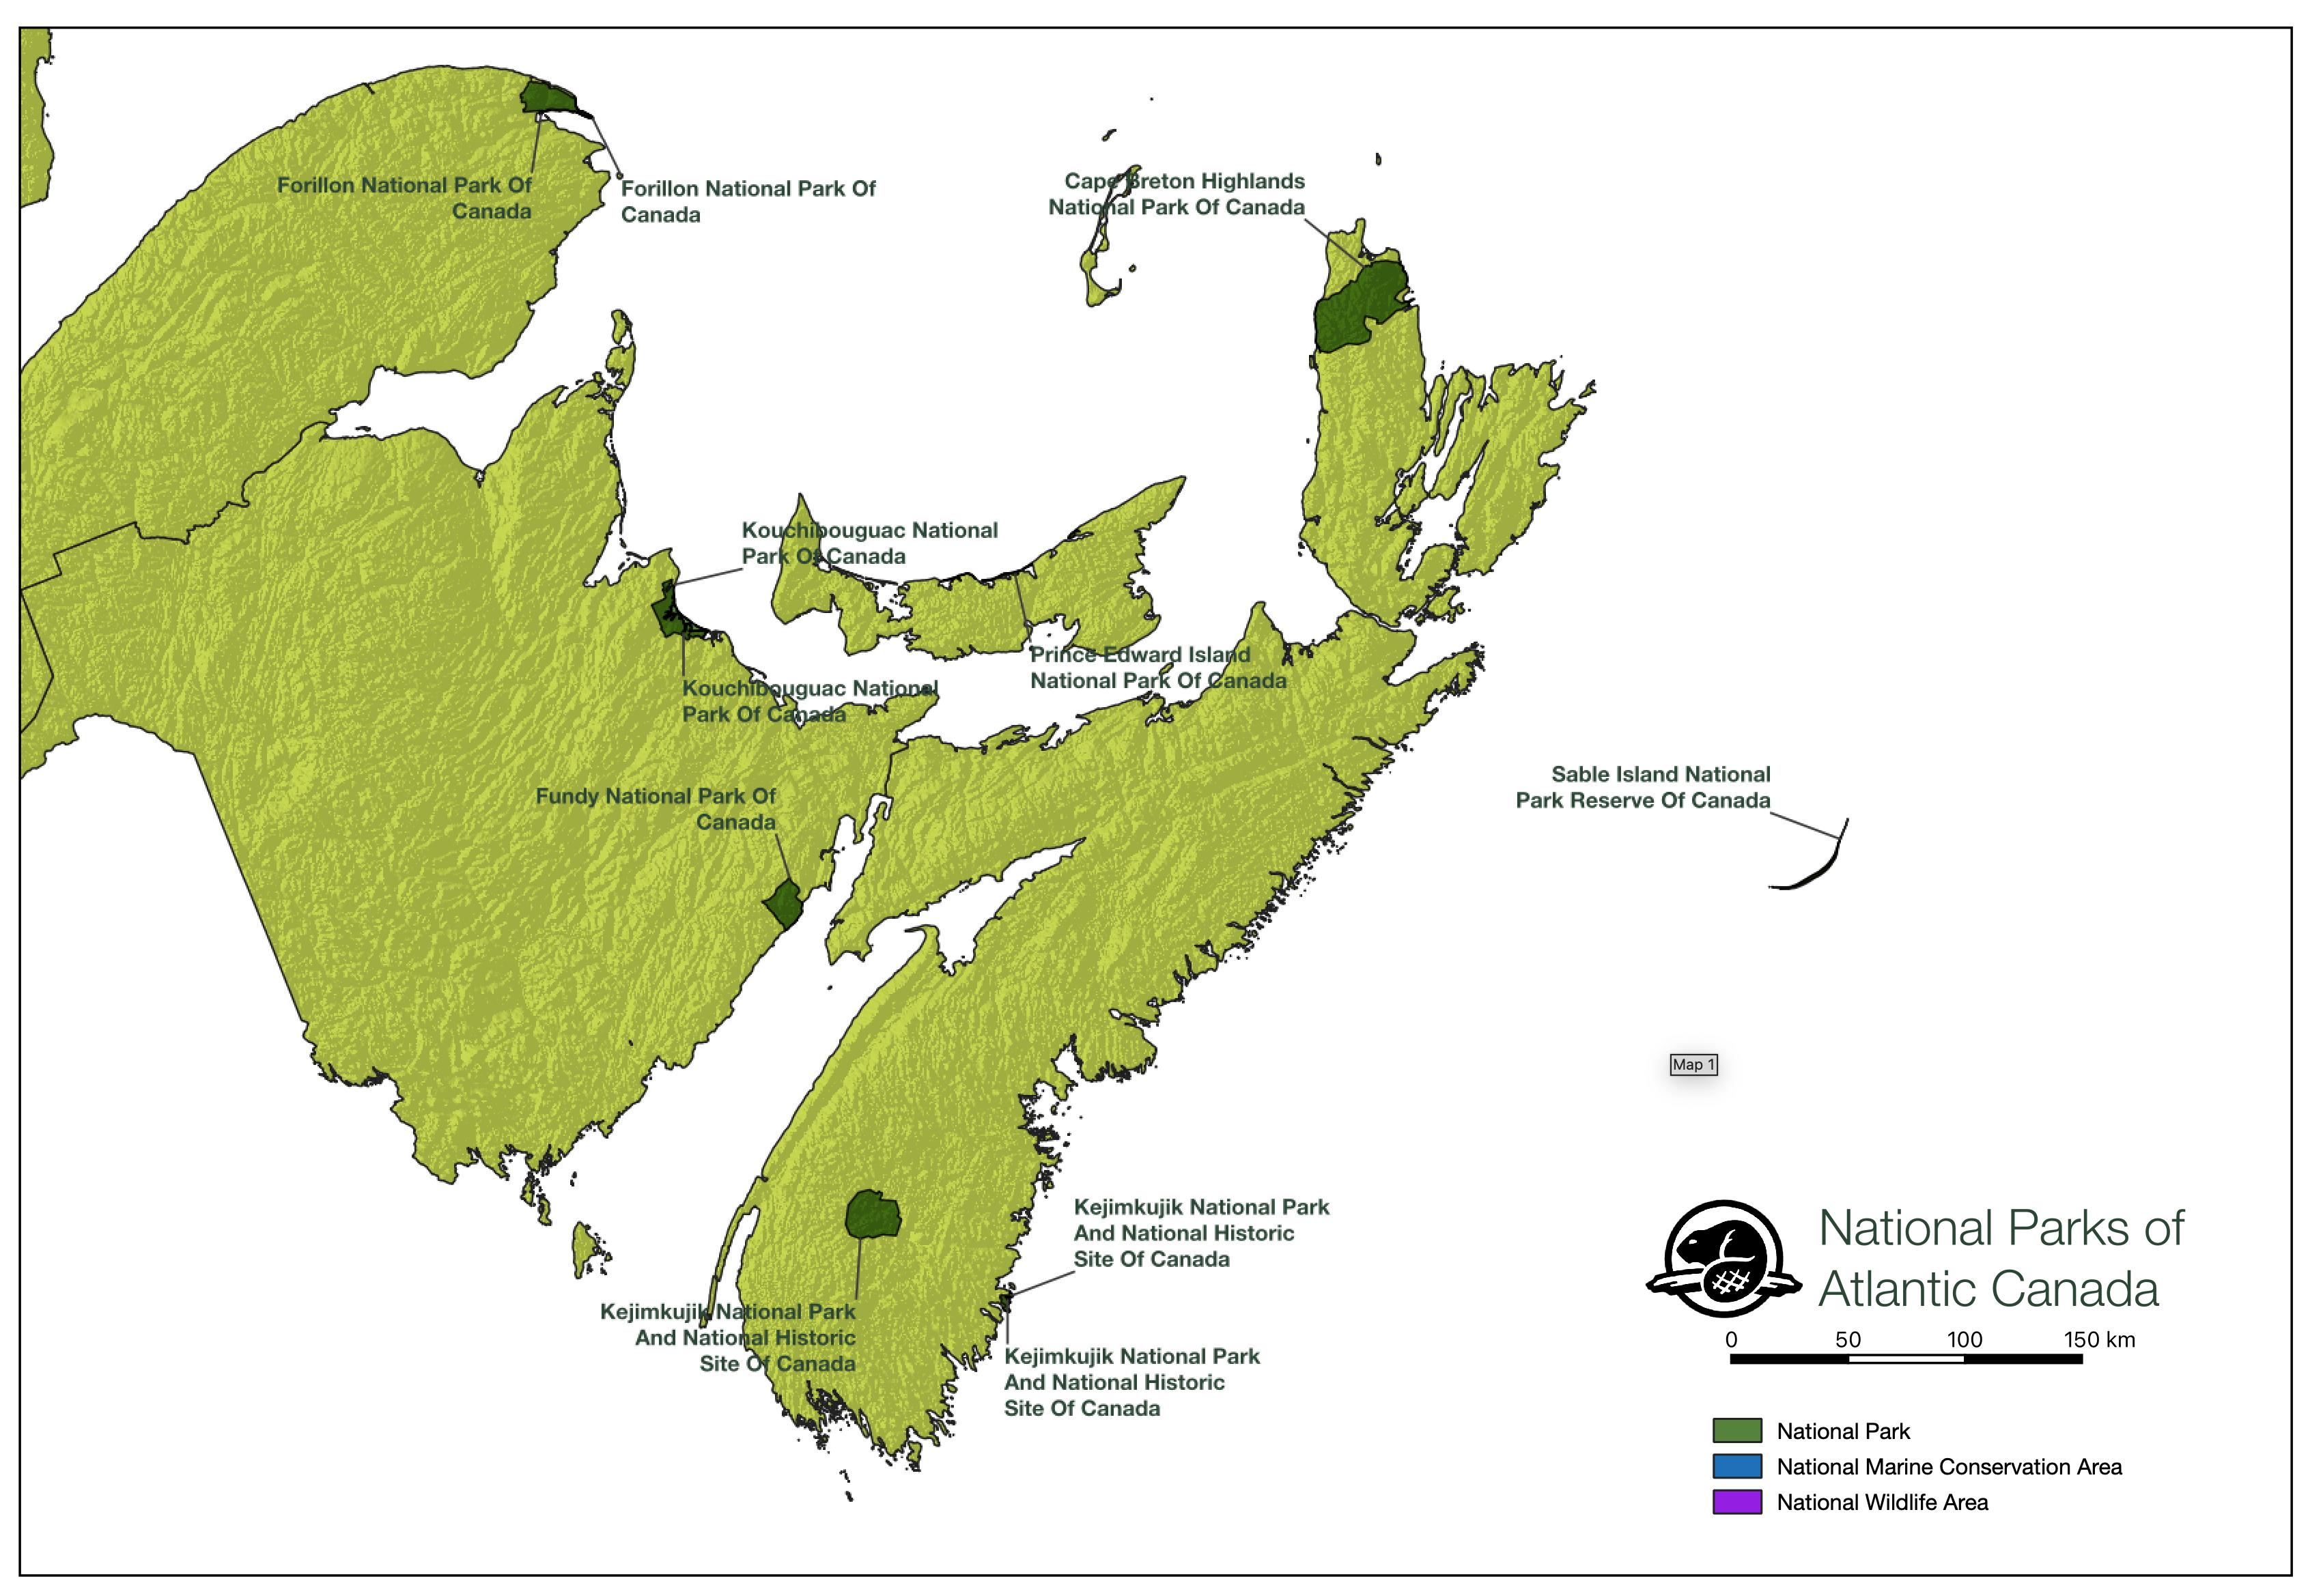
Day 7 – Green
National Parks in Atlantic Canada. I used the Official Parks Canada Greens for this map, and their Helvetica Neue font as well. Parks data came from the Canadian Protected and Conserved Areas Database (CPCAD). hillshade is extracted from Gebco.
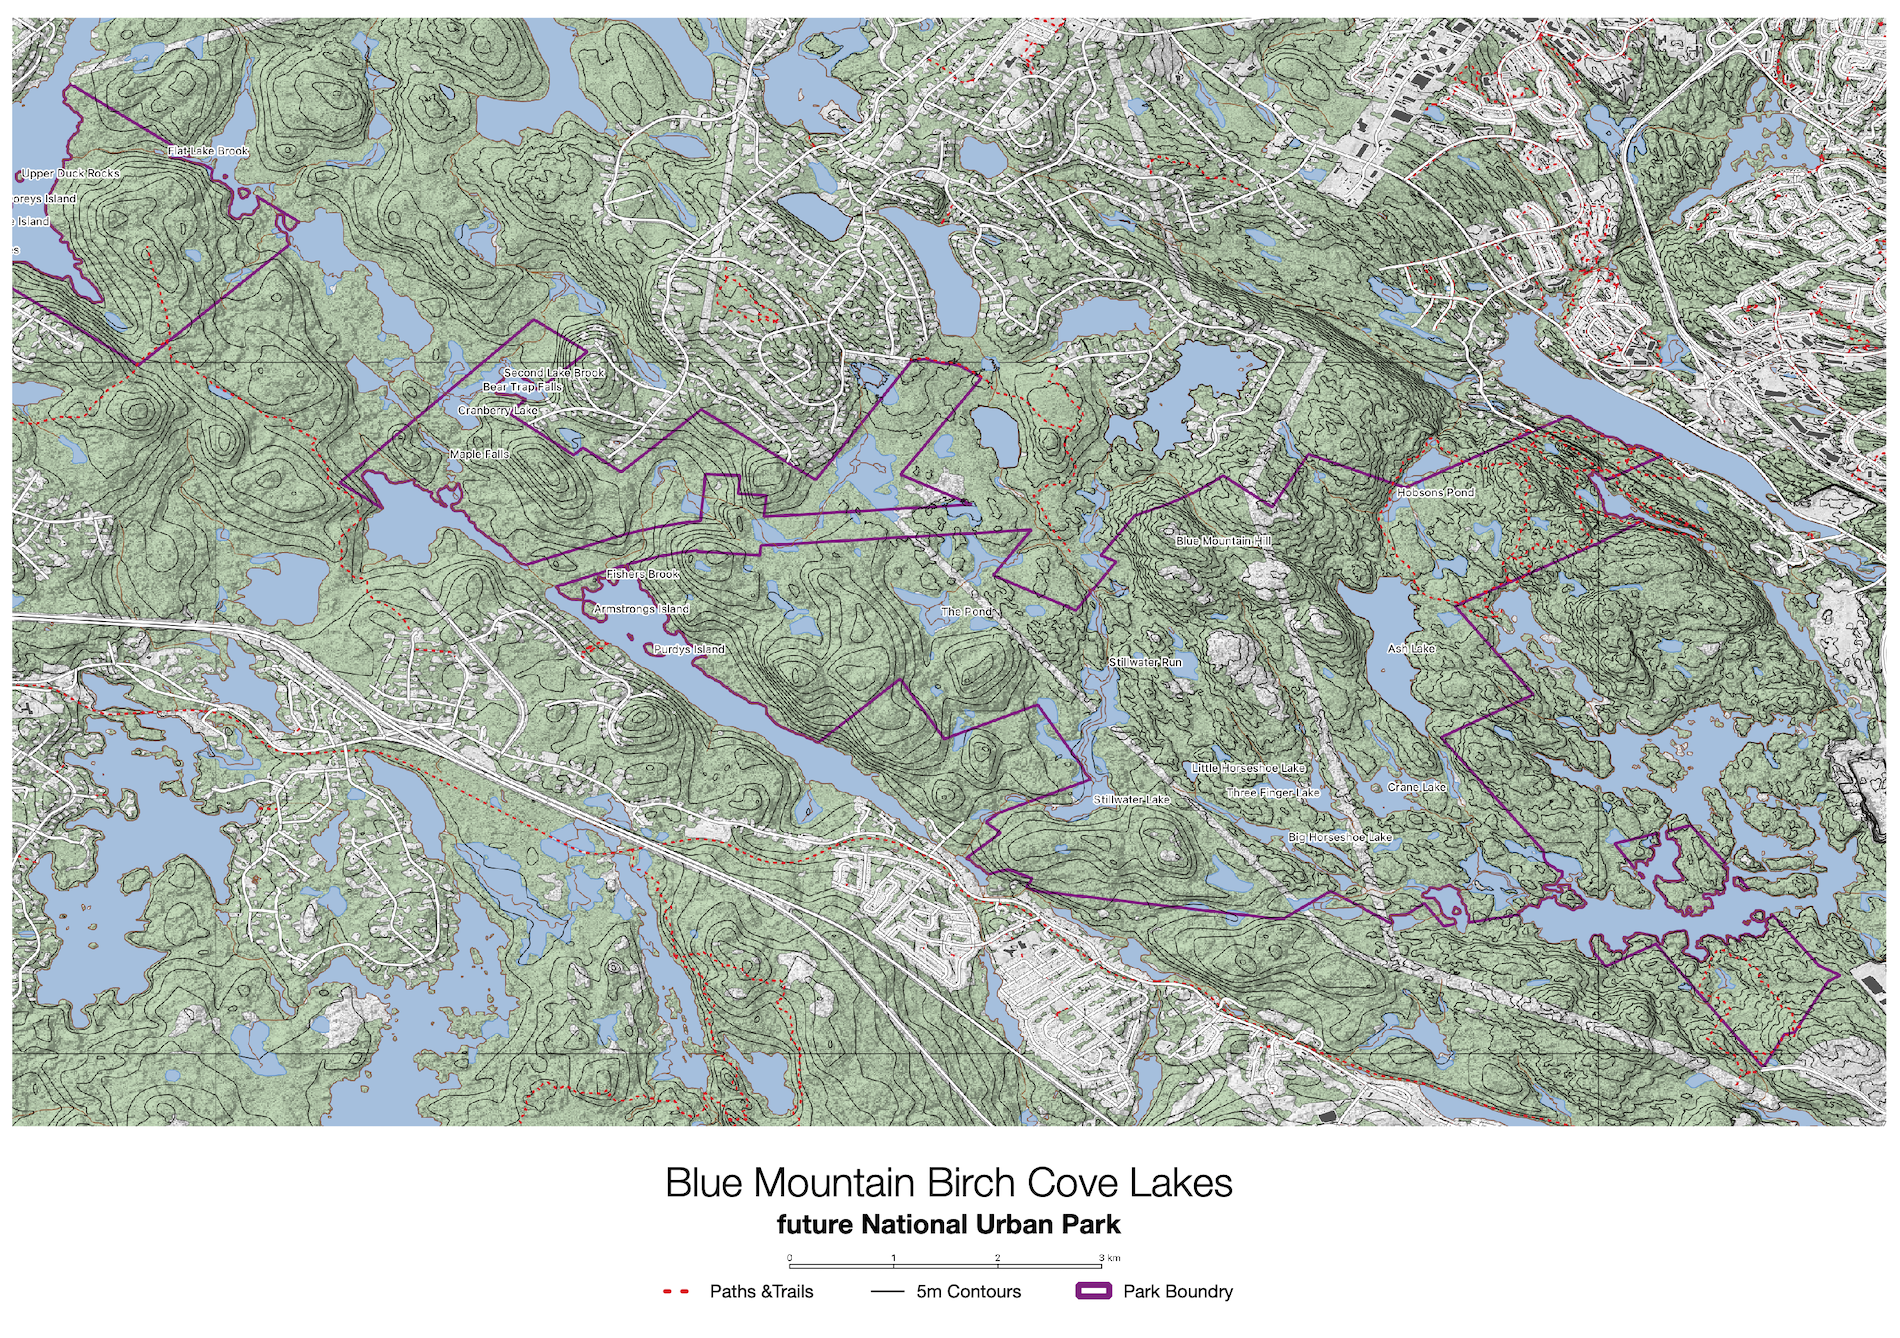
Day 8 – Blue
with a blue theme, i chose to map Blue Mountain Birch cove lakes protected area. The city owns the land highlighted in purple, but the goal is fill in in the park. there are advanced discussions underway for the area to receive national urban park status.
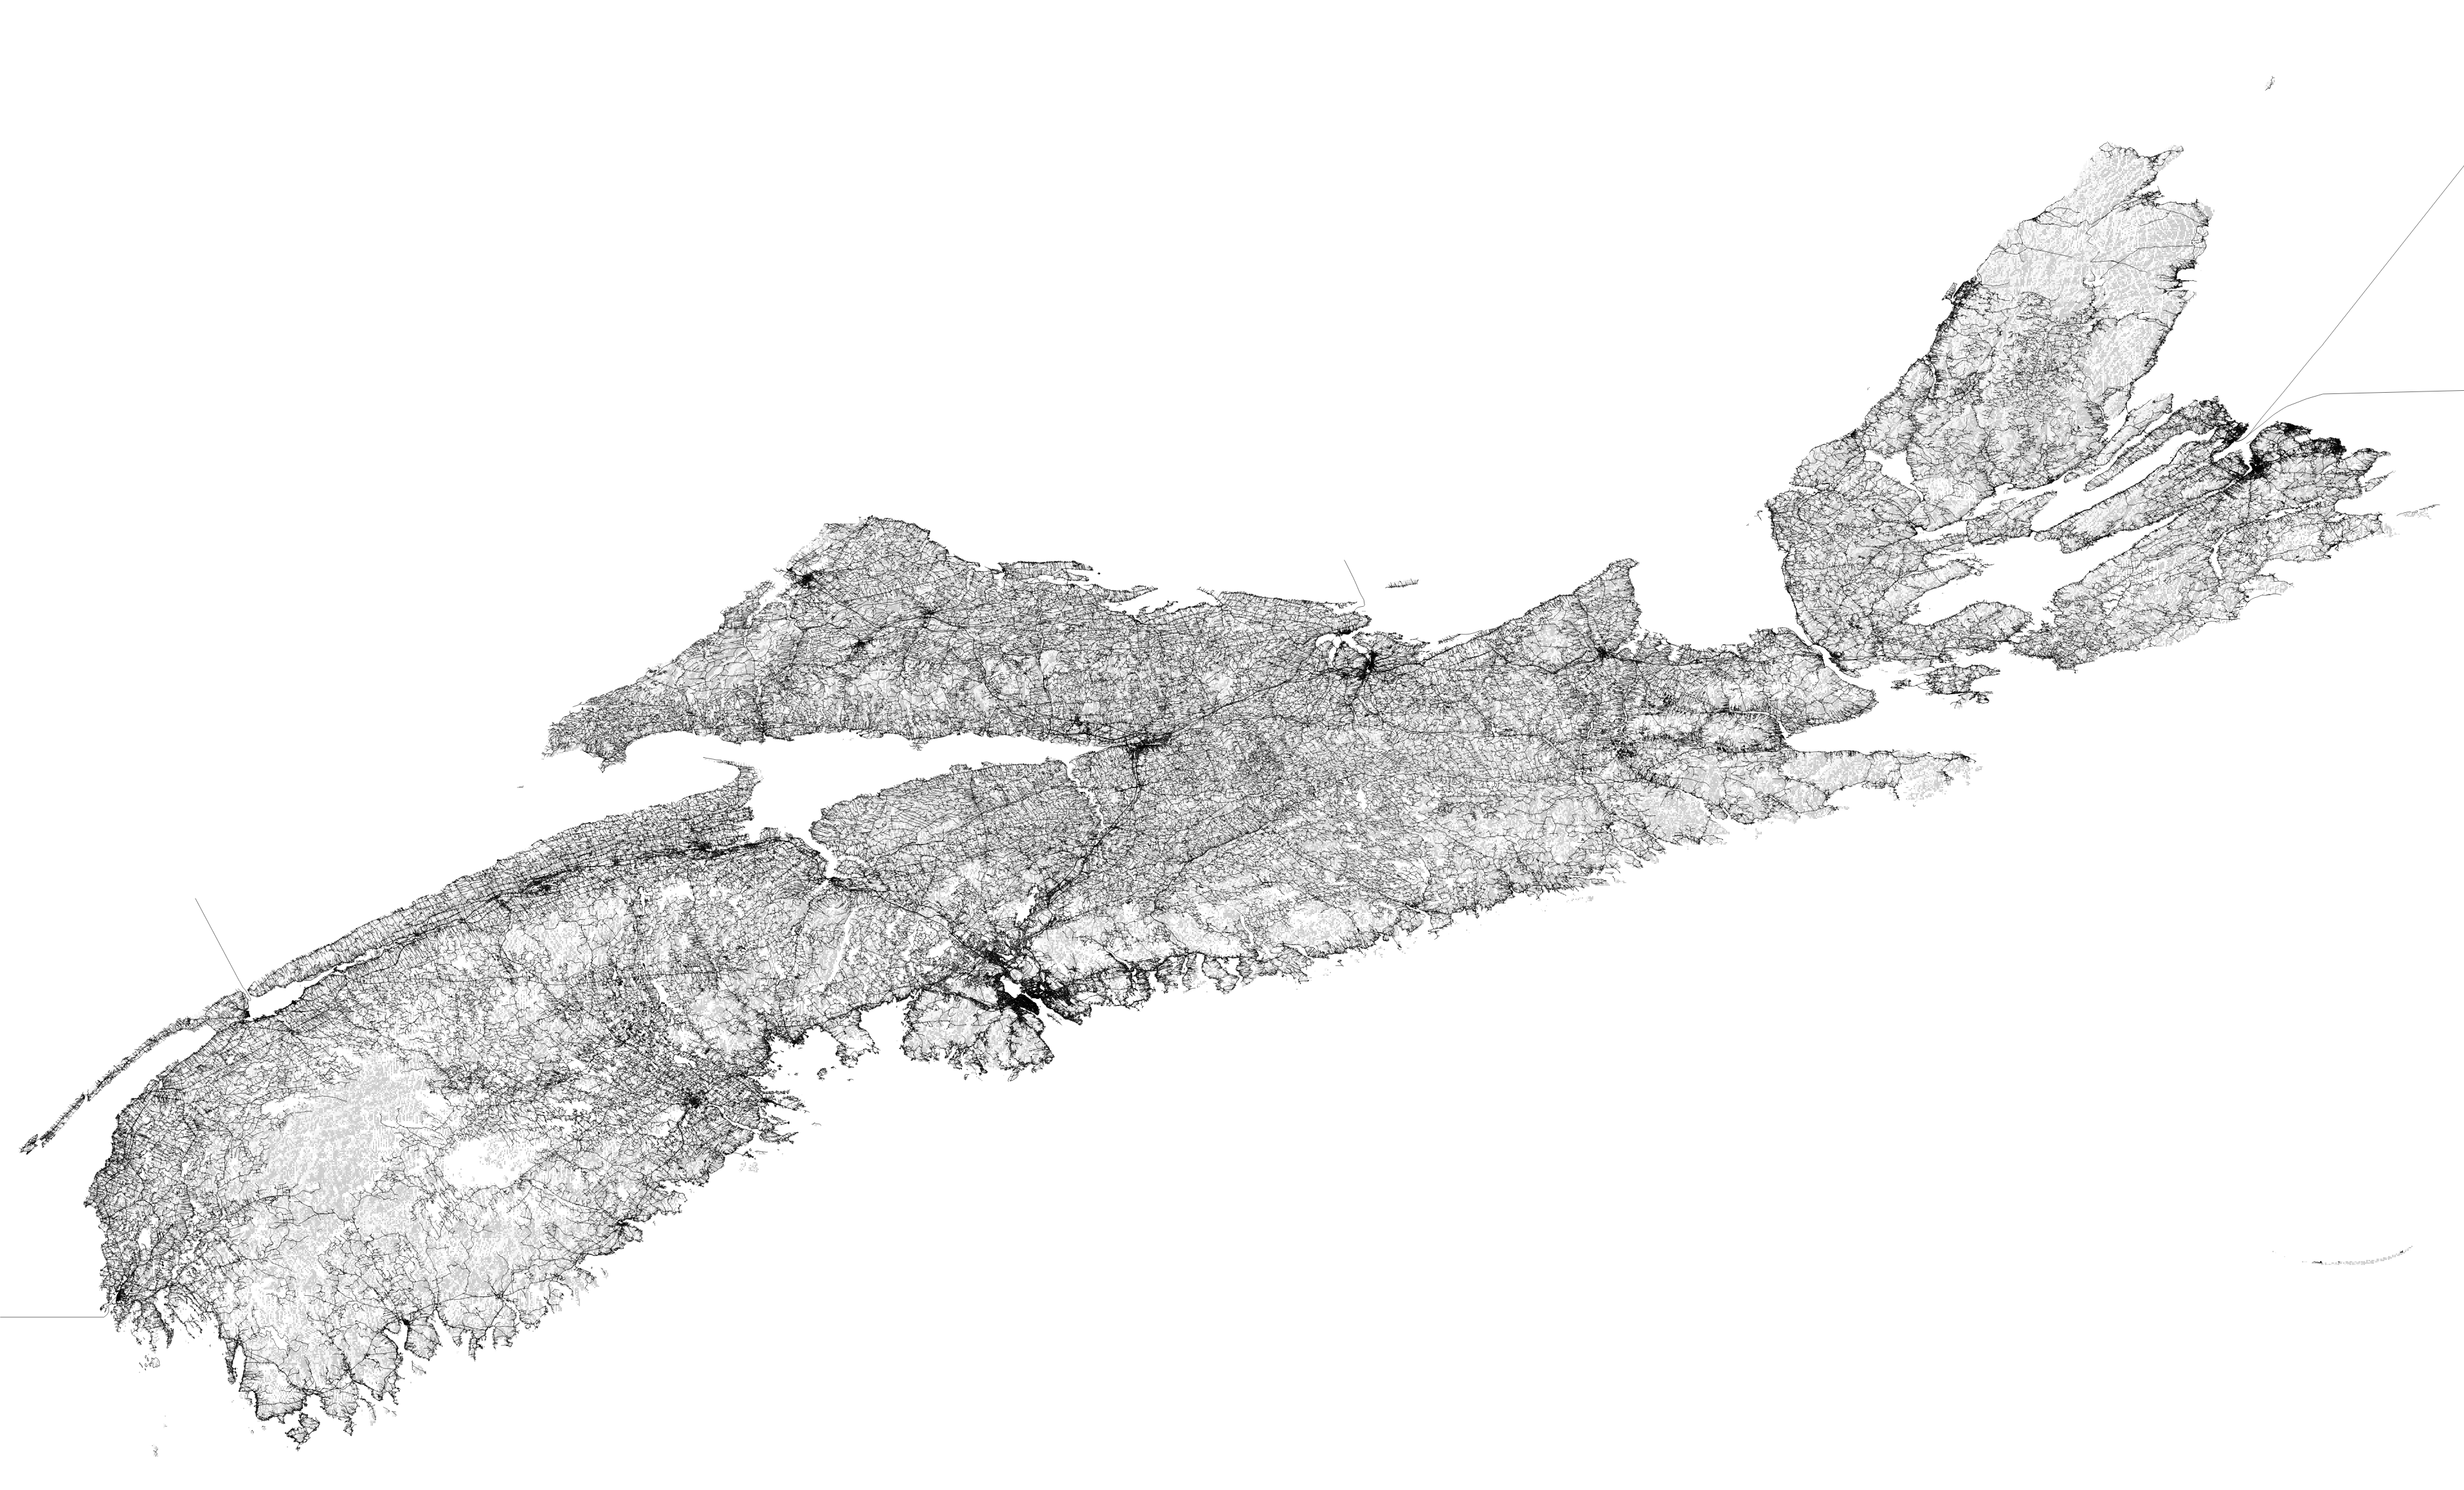
Day 9 – Monochrome.
This map was made with the Province of Nova Scotia’s Digital Terrain Model data, and Roads, Trails, and Rails overlayed. it gives a nice texture to the province, showing both the form of the land, but also human settlement. Both datasets are available via GeoNova
Day 10 – Raster
using the cities 1m lidar DEM, i extracted Point Pleasant park using the cities park shape file. the 1m resolution lets you clearly see paths through the park, and the remains of the old military installations.

Pingback: 30 Day Map Challenge Pt.3 | Halifax Shipping News.ca