
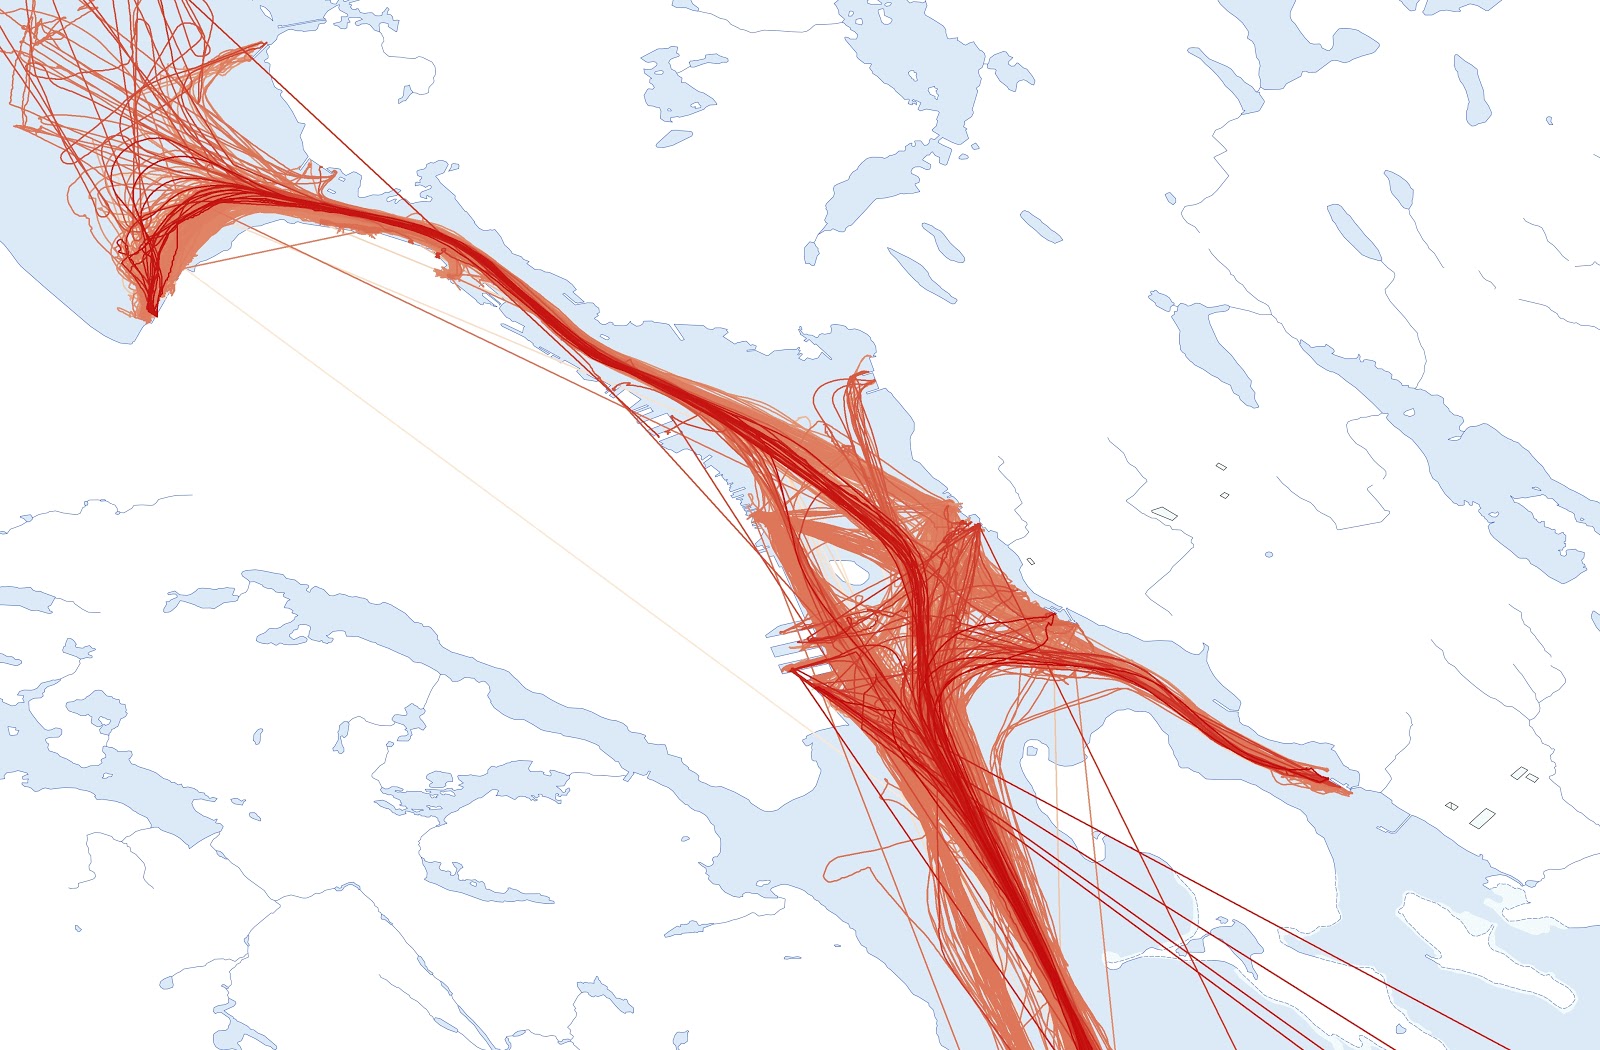
The Image above is all traffic in Halifax Harbour, for the month of November 2011. (1:150000 scale)
the images were produced from the position data of the various vessels transiting the harbour. the individual points were joined to form lines, then overlaid on Halifax in Arcgis.
(Below 1:7500 scale HalTerm)


Pingback: Wednesday is the new Thursday – Weekly News #10 | Halifax Shipping News.ca
Pingback: One Month of Traffic – August 2016 | Halifax Shipping News.ca
Pingback: Port Traffic | Halifax Shipping News.ca
Pingback: One Month of Ship Traffic – Sept. 2020 traffic | Halifax Shipping News.ca