Oceanex Sanderling was the last vessel to Depart Halifax on the 31st. The car carrier Siem Aristotle took to the outer anchorage the evening of the 31st, but is currently scheduled to be the second vessel to enter the harbour tomorrow morning, After the Atlantic Sea.
New years day saw 2 departures, The CCGS Geliget sailed from BIO for the bay of Fundy on the first, and HMCS Halifax Deployed on Op Reassurance.
The Sailboat Merlin, based at the Armdale Yacht Club, looks to have gone for a cruise in the NW Arm, taking advantage of the Sun and above zero temperatures.
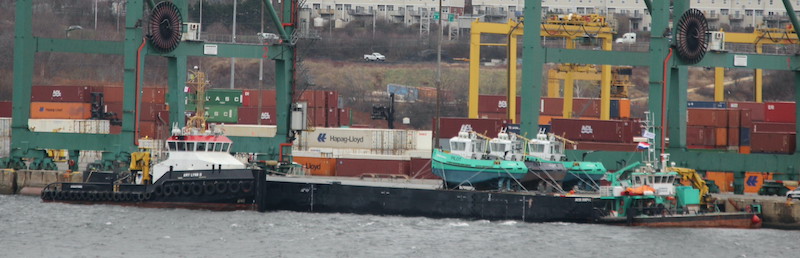
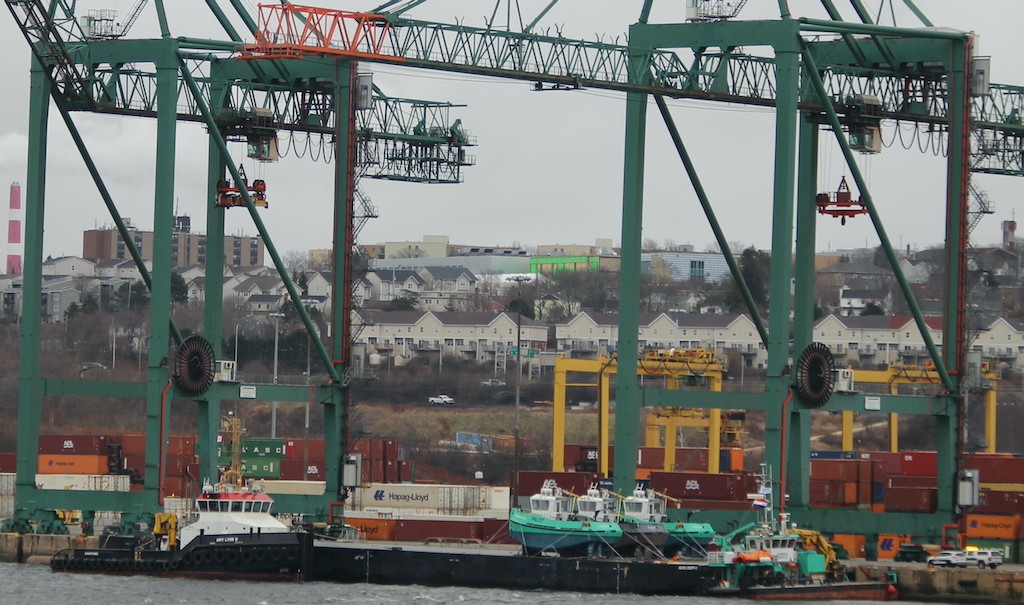
The Amy Lynn D with the barge moved to Fairview cove this morning, where the gantry crane will lift the two tugs off the marge and place them in the water. you can see the container spreader has been fitted with a lifting hook.
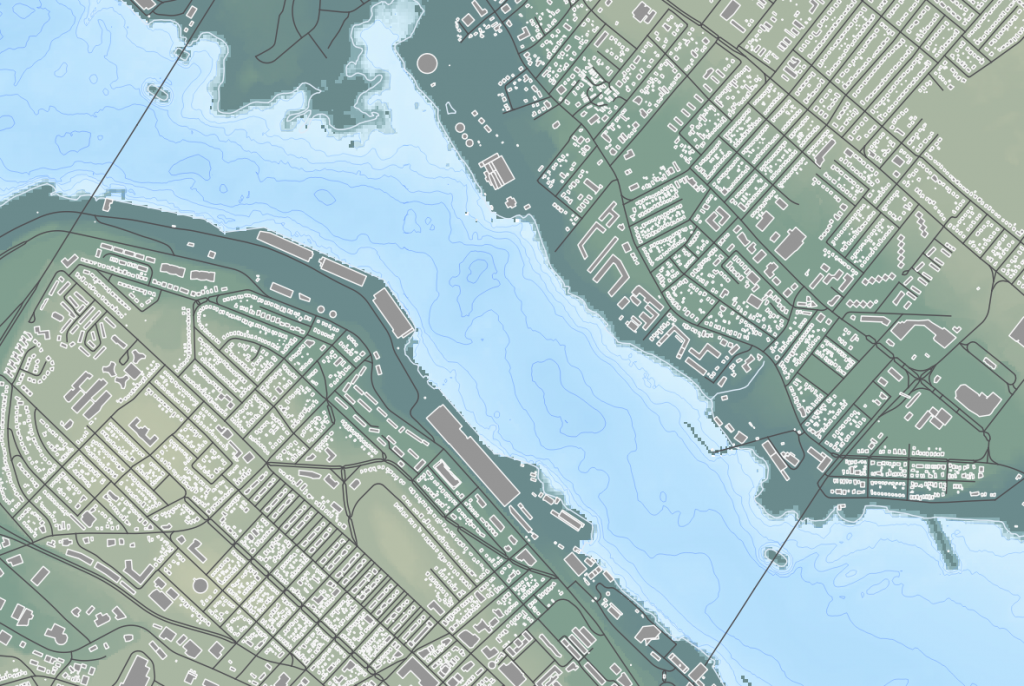
This post is going to describe a process to create a nautical chart. It will be done using Open Data, and QGIS 3.14 and is intended to be suitable for general interest audiences, as well as GIS Professionals.
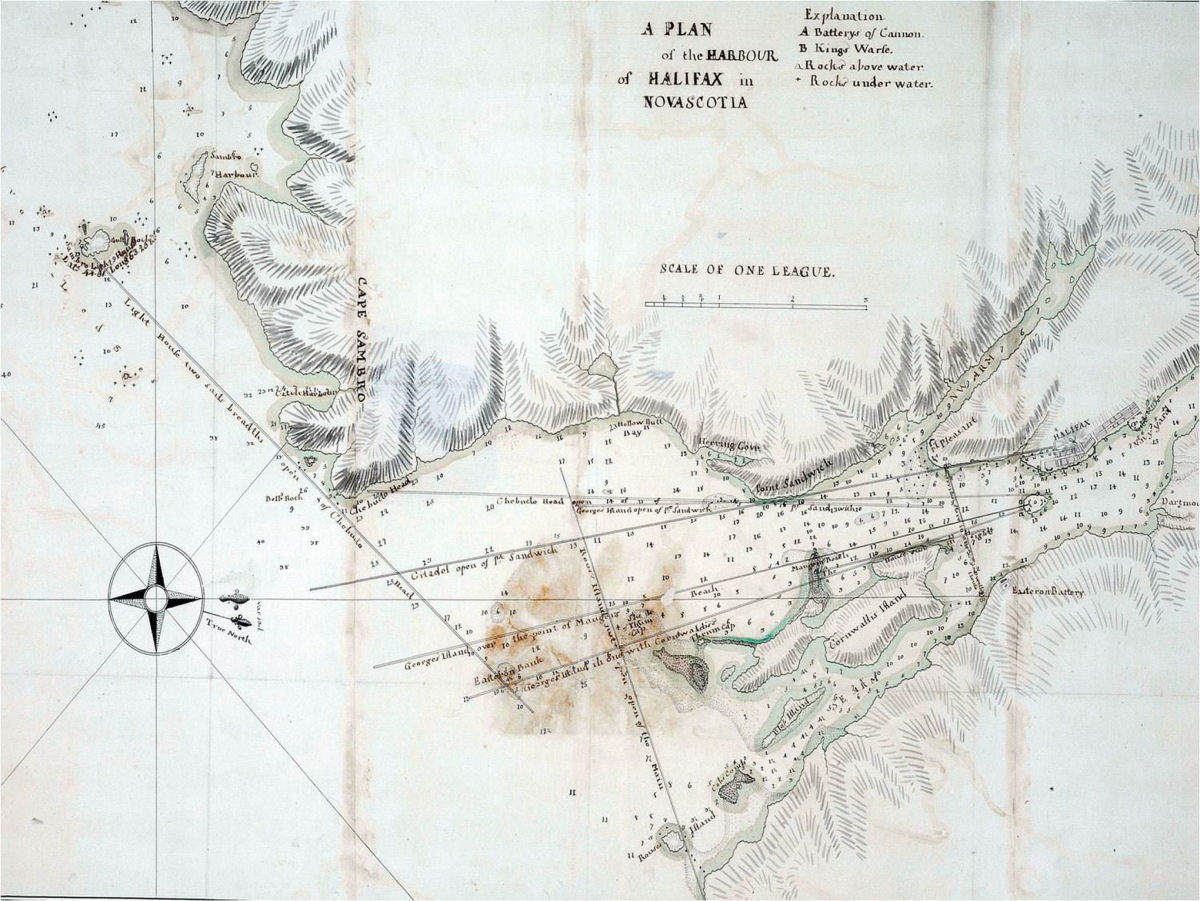
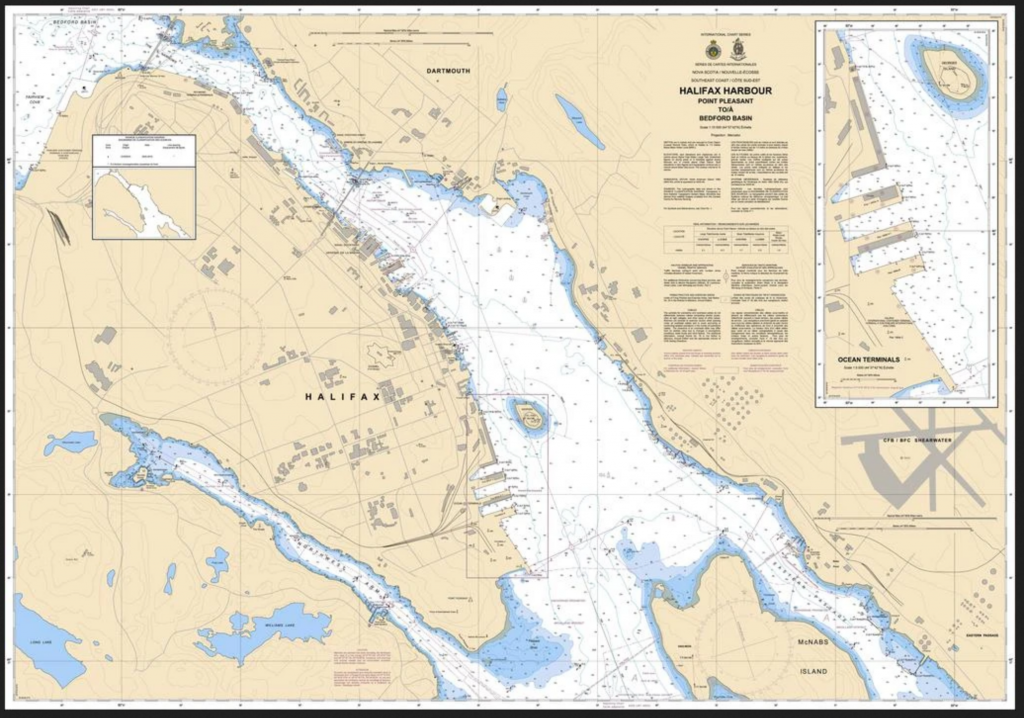
Chart of Halifax Harbour by James Cook.
nautical chart production begins with a Survey. In times past, surveyors would go out in a small boat and take soundings with a lead line. those soundings would be located via triangulation to survey monuments located on land, themselves accurately positioned by use of a sextant. the problem with this method however is that lead lines can only tell you the depth of the single spot. multiple soundings will give you a good idea of the general depth, of an area, but can miss isolated rocks and other hazards. Modern Chart production begins with Multi-beam Sonar scan.
Bathemetry
Multibeam sonar results are then rendered into a GeoTiff. A geoTiff is basically an image file that is geographically referenced, and each pixel contains height (or in this case depth) data. in this case we will make use of the CHS Nonna-10 data set. This data set is “non-navigational”, in that it is not considered reliable enough to use for navigation, but is suitable for our exercise.
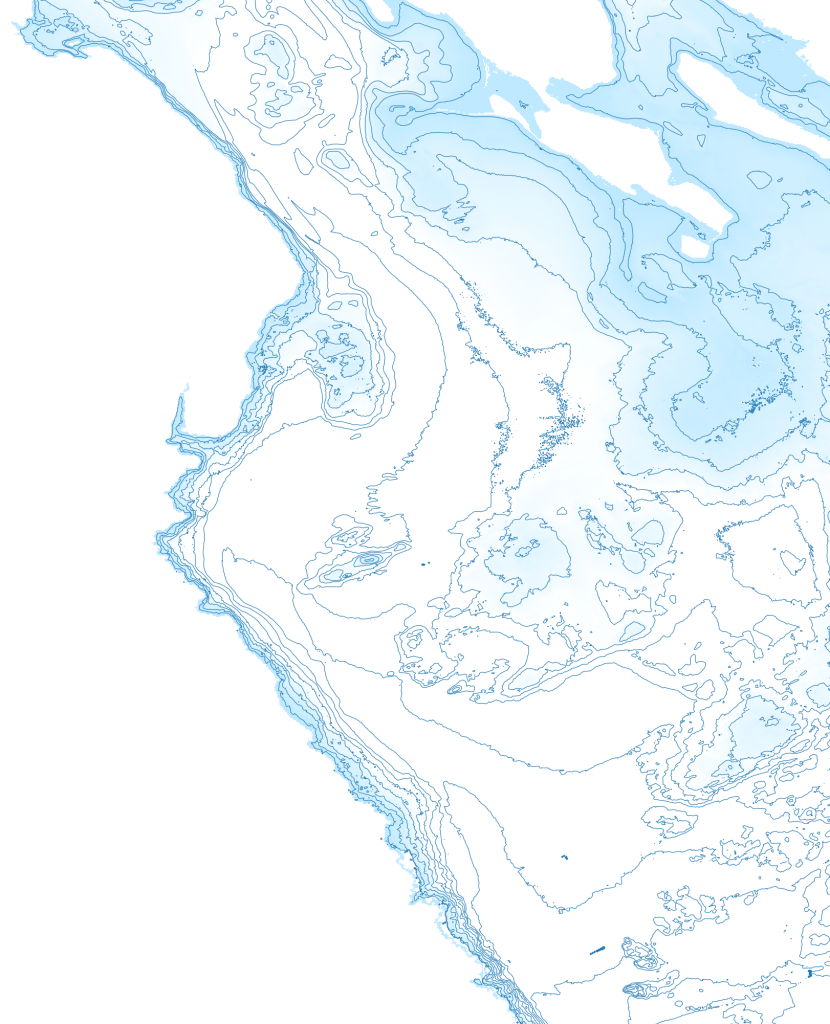
the ray greyscale NONNA-10 Data.
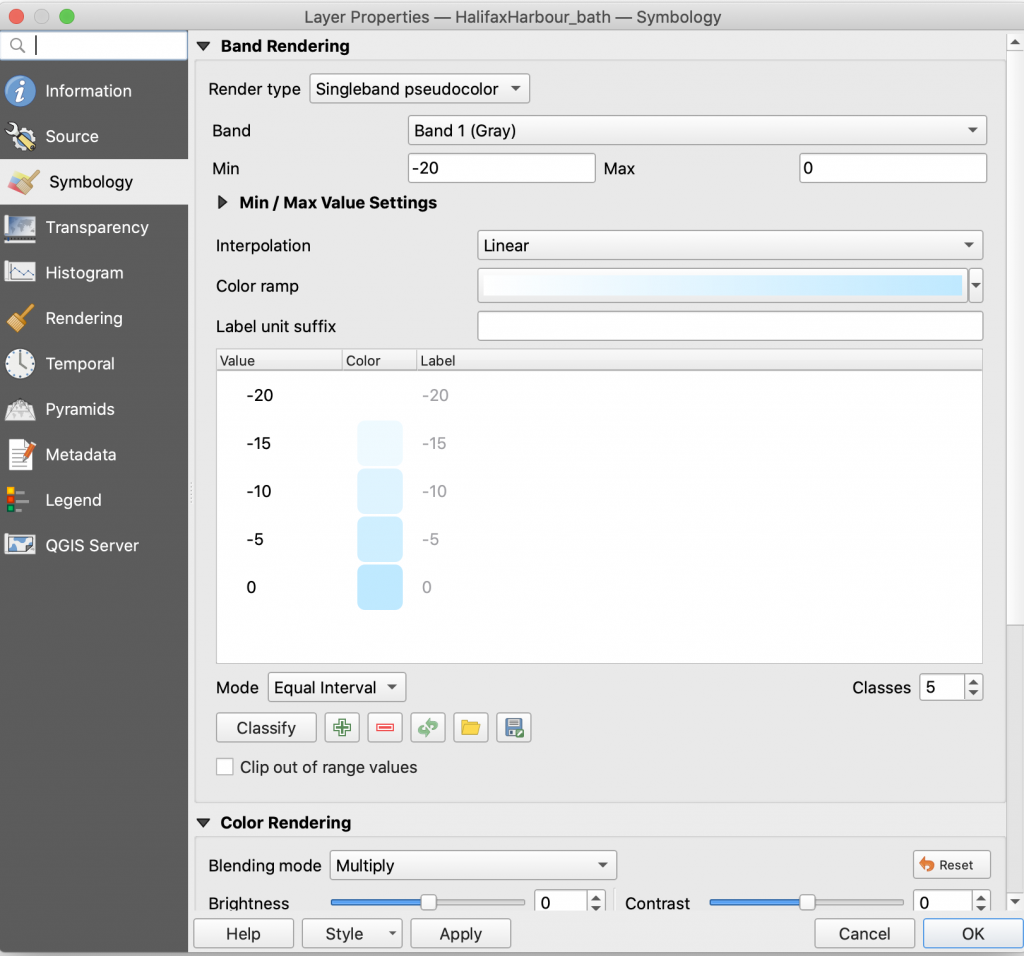
NONNA-10 data comes in individual tiles. once the tiles are loaded, we can perform a raster merge function to join them into a single file. Then change the render type to Singleband Pseudocolor, and apply a suitable color ramp. I chose a ramp that would give a blue highlight around the coast line, and white for waters 20m and deeper.
Next I Ran a Raster Extraction Contour, and set the Interval between contour lines to 5.00, to generate 5m contour lines.
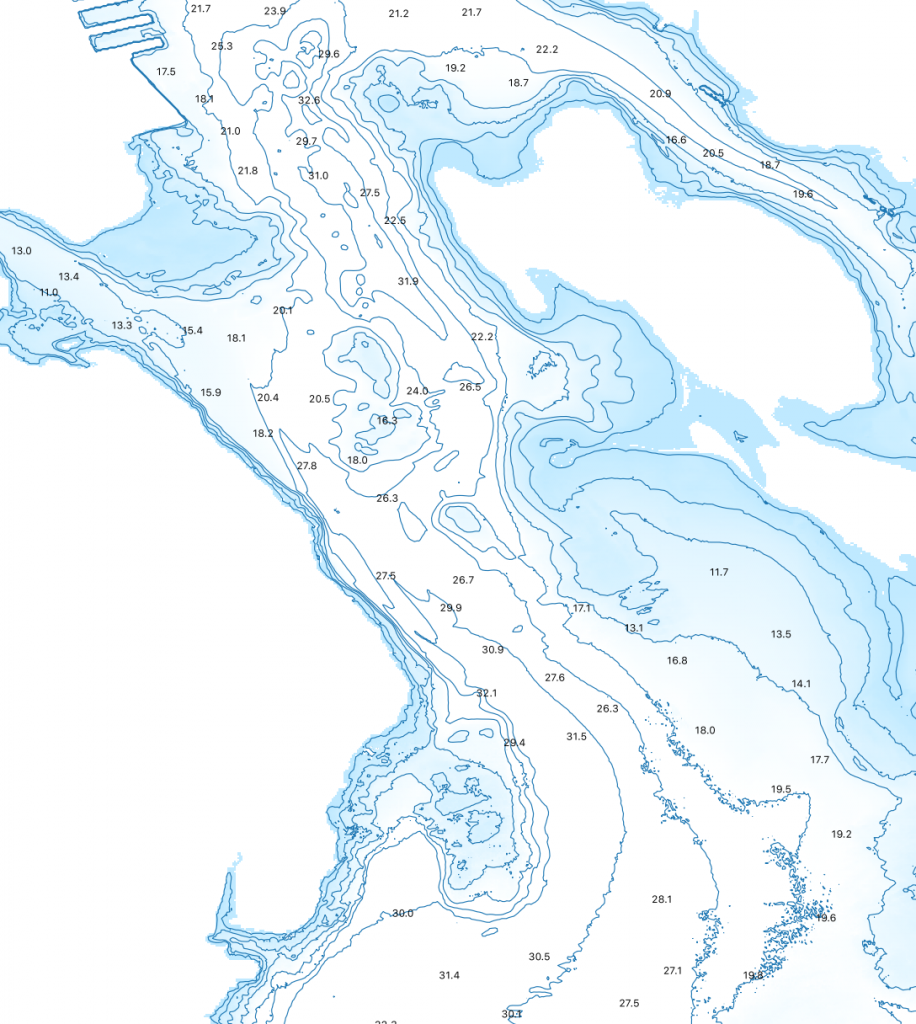
to get spot depths, i created a new point shape file, creating a bunch of points. those points then get used in the Sample raster values tool, which pulled the depth value from the raster file and generated a new point layer. We set the transparency of the points on that layer to 0, making them invisible, and then applied a labels with the depth. Our Values came back with a – sign in front, so we used the equasion editor for the source set to replace(rvalue_1, ‘-‘,”)
Land Features
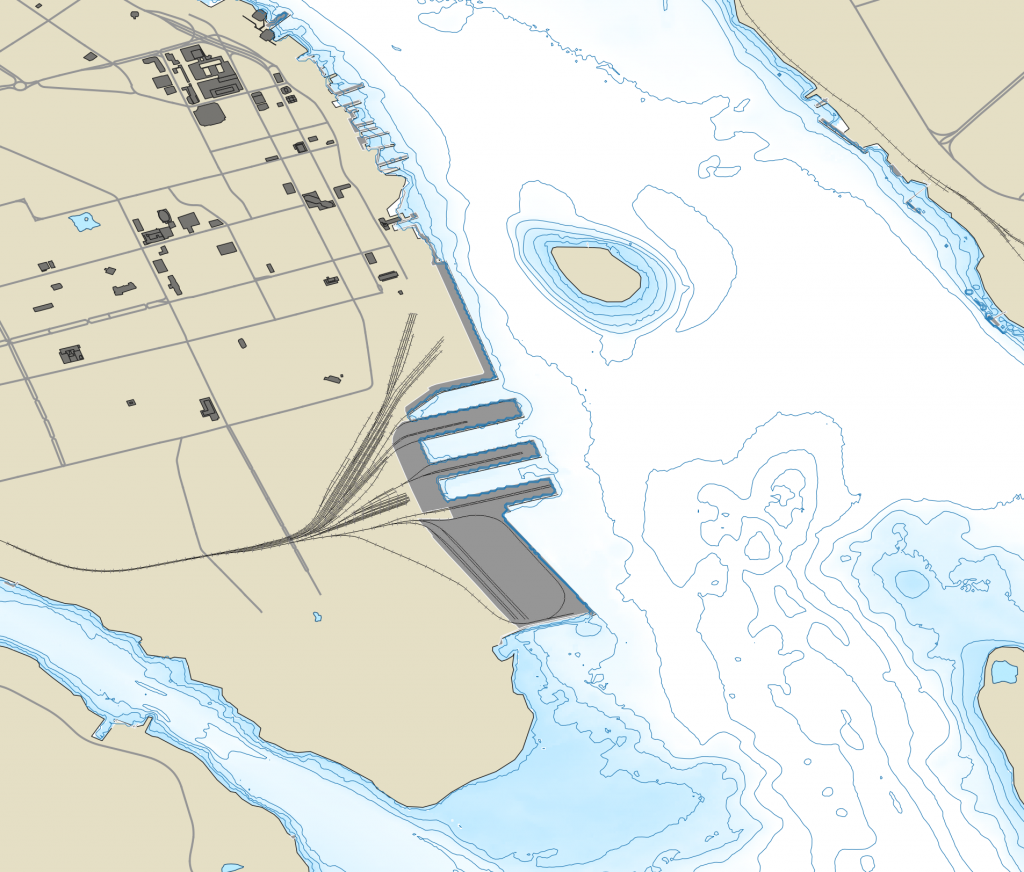
Terrestrial Features were derived from the StatsCan boundary files and the Marine facilities and inland lakes from the Nova Scotia Topographic Database – Water Features Shapefile. Halifax open data has a street centerline layers that can be used to populate terrestrial areas. the center lines were adjusted so only the major streets were symbolized, all with a dark grey symbology.
the open data portal also includes a building outline layer and buildings over 6 stories were symbolized. unfortunately a number of buildings lack floor data, so significant ones will need to be edited to add values so they display – theses are mostly features such as the grain elevator, Emera Building, and various transit sheds at the port.
Nautical features are generated from a number of sources.
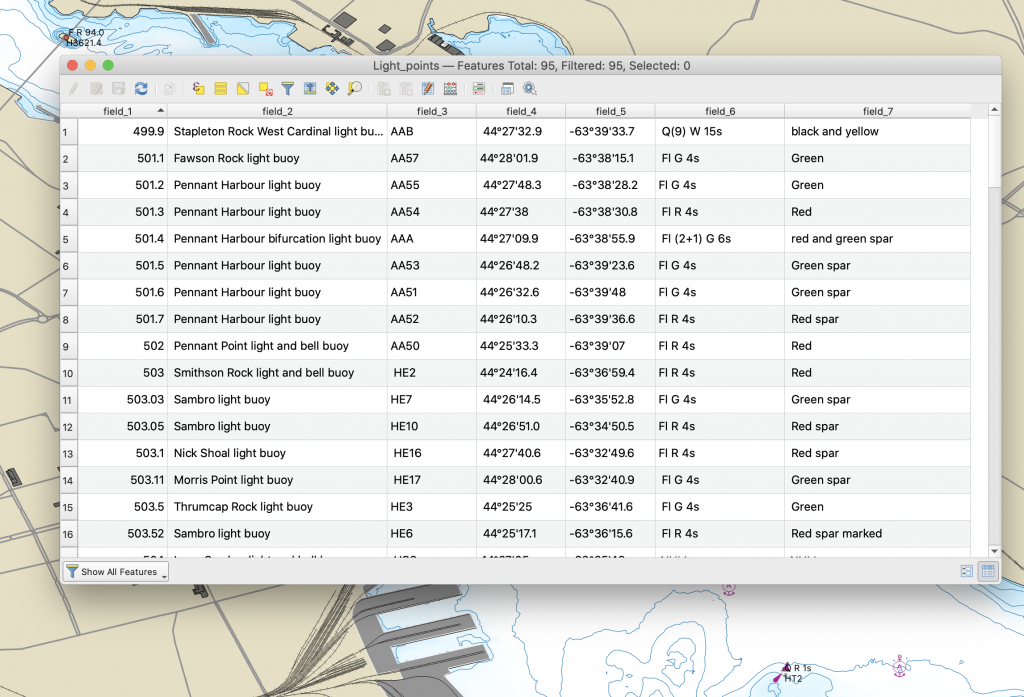
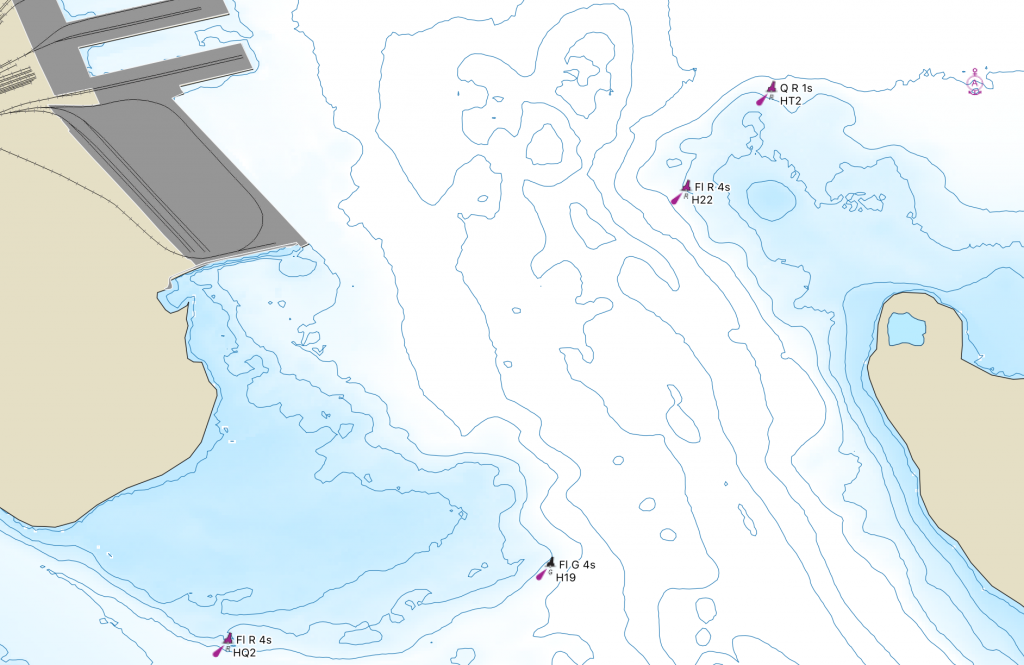
The list of Lights Buoys and Fog signals was converted into a point shape file, and then each type of buoy symbolized used the appropriate symbol from chart #1. The table includes the features name, code, position, characteristics and type.
the symbols are literally svg files taken form chart#1, and and then the individual buoy expanded. The Symbols are assigned based on the values in Field 7, and the features labeled with the light characteristics (field_6) and code (Field_3)
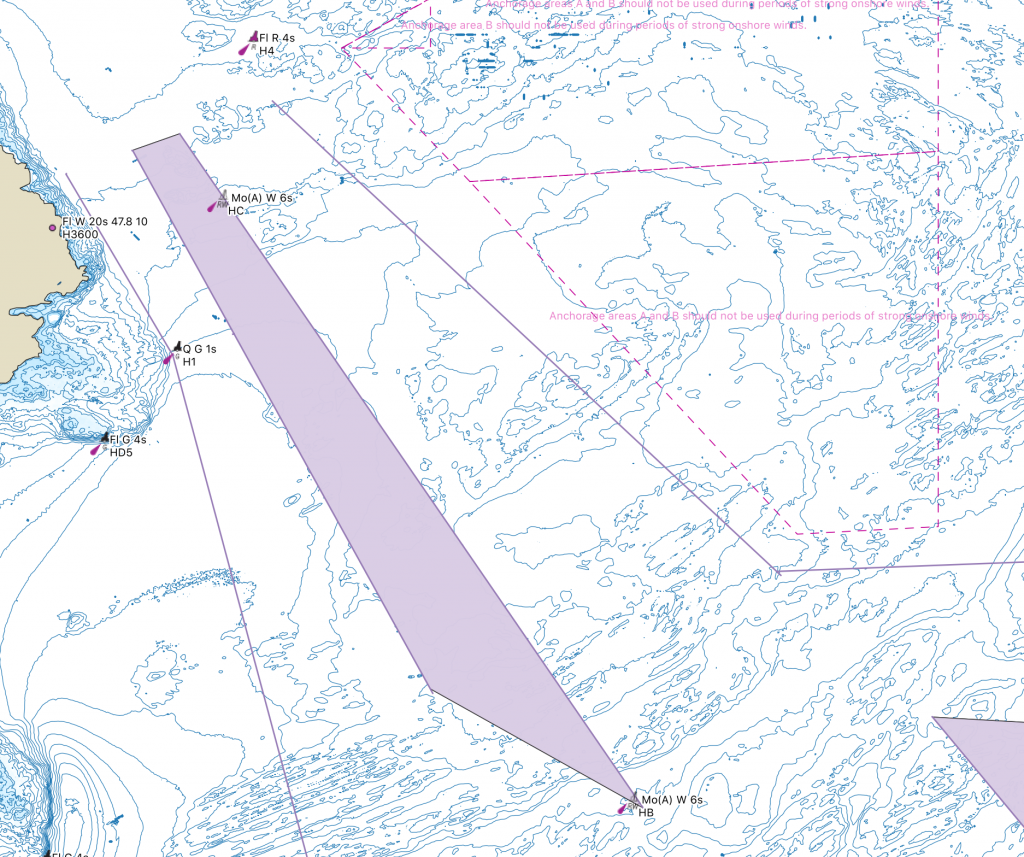
The anchorage data was provided by an open data set of Canadian anchorages. The inner anchorages are symbolized as above, and the outer Anchorage area was defined as a hollow polygon with a dashed line. The warning data was contained in the data set.
Traffic separation scheme in the approaches.
The traffic separation Scheme came from open data Vessel Traffic Routes. The traffic lanes in the outer approaches were edited to conform with CHS Charting practice, and to improve Appearance. The scheme also included data for Ranges, and the ferry track which were cleaned up and simplified.
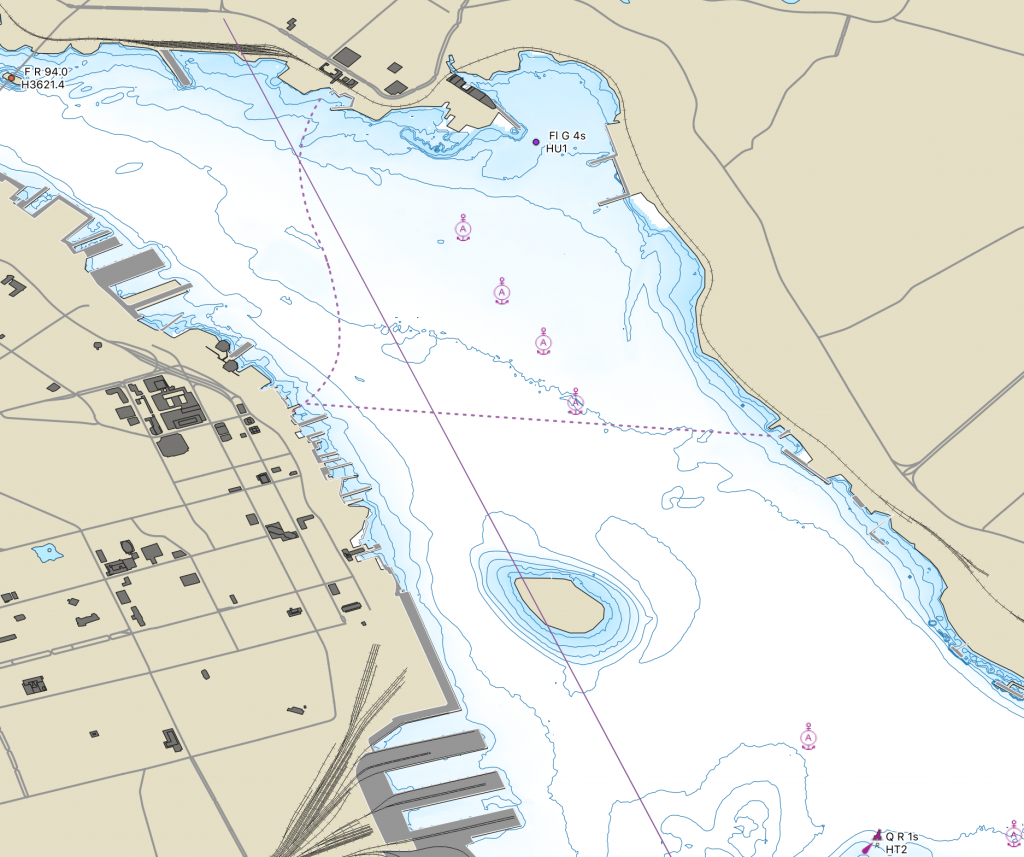
Ferry Track, and Harbour inner range.
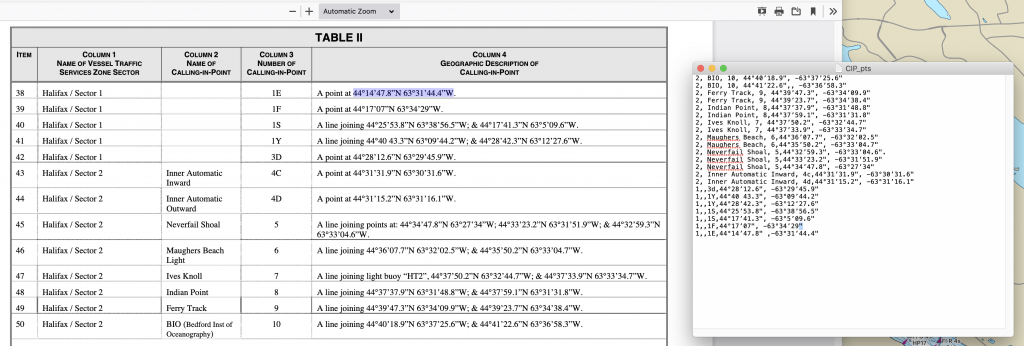
VTS Call in points were generated by creating a csv file of all the points taken from VTS Zone Regulations which define the Call in Points, then running the Points to path tool to connect them.
building the callinpoint shapefile.
The Call in Points were then symbolized with a line, and the a label applied, using the SVG Callin point symbol as a background for the Label. Placement was arranged to centre the point number in the centre, and have the symbol span the line.
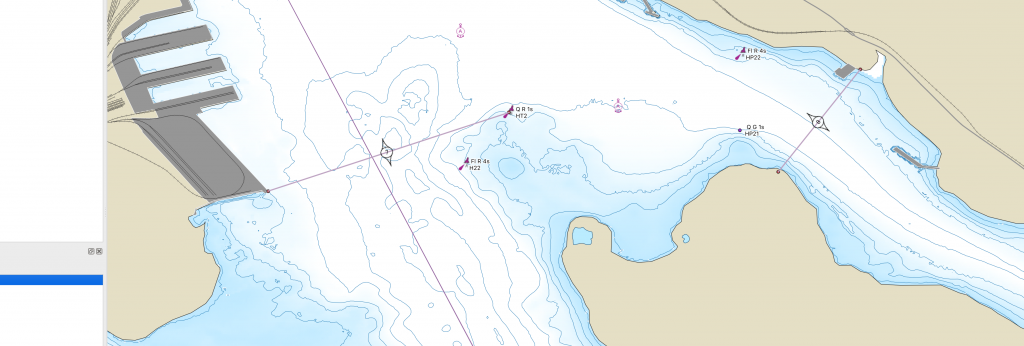
Call in points 7 (Ives Knoll) and 8 (Indian point)
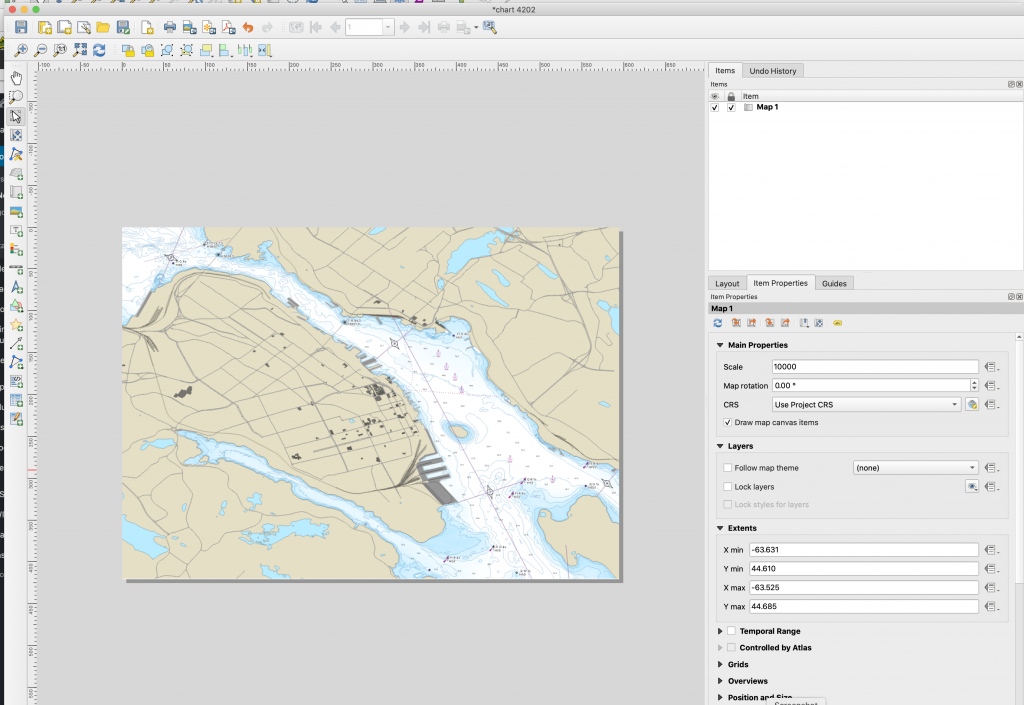
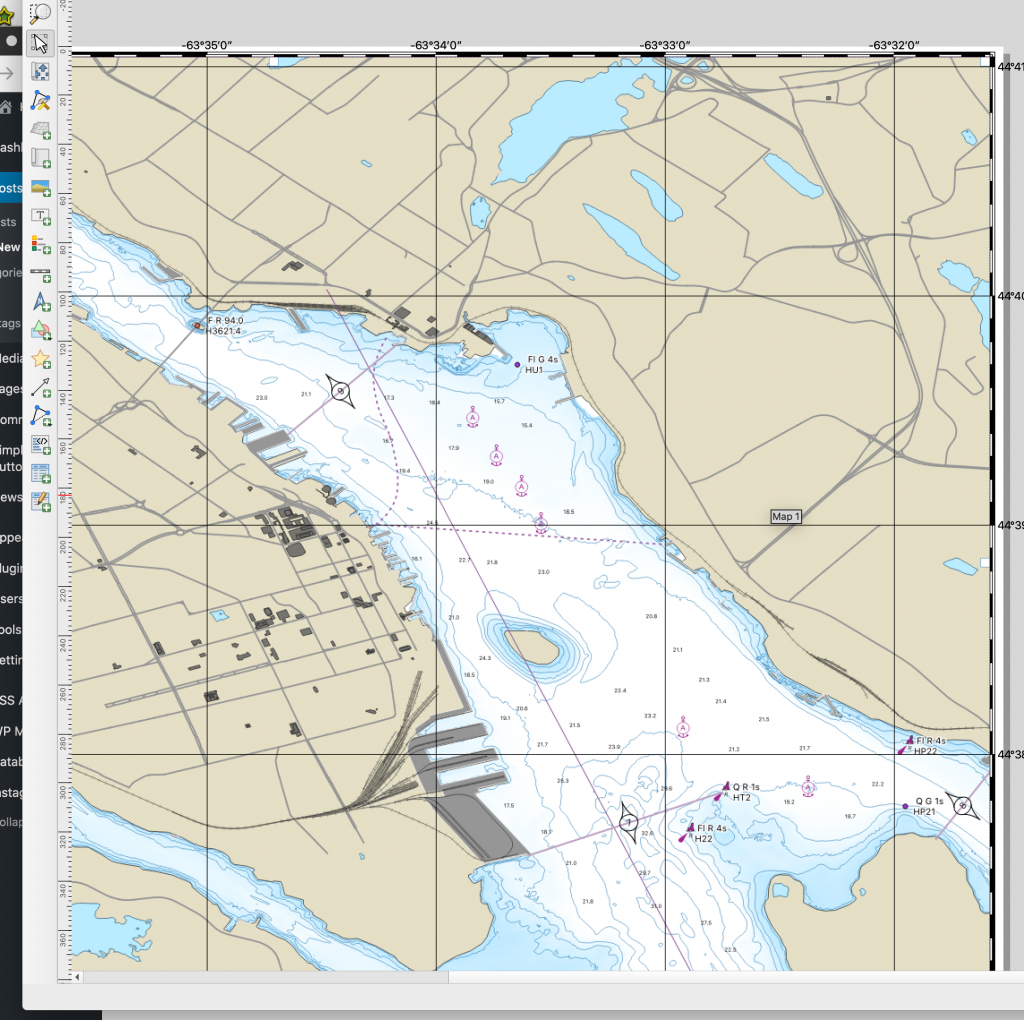
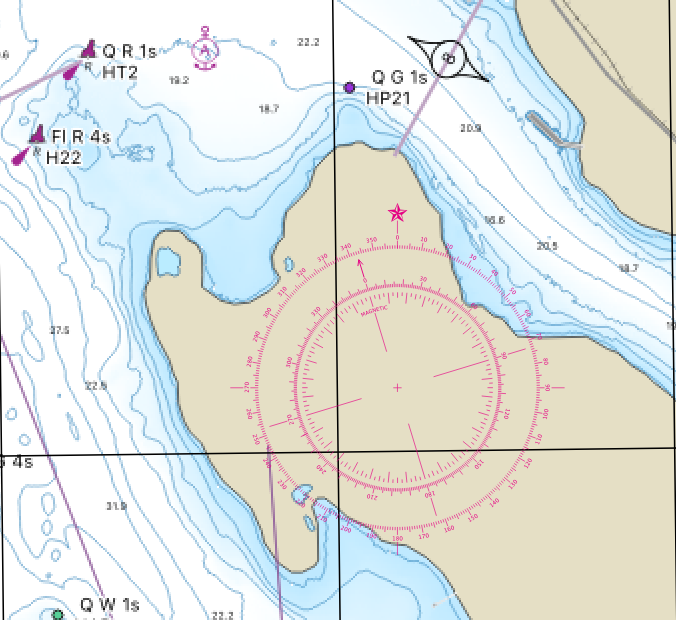
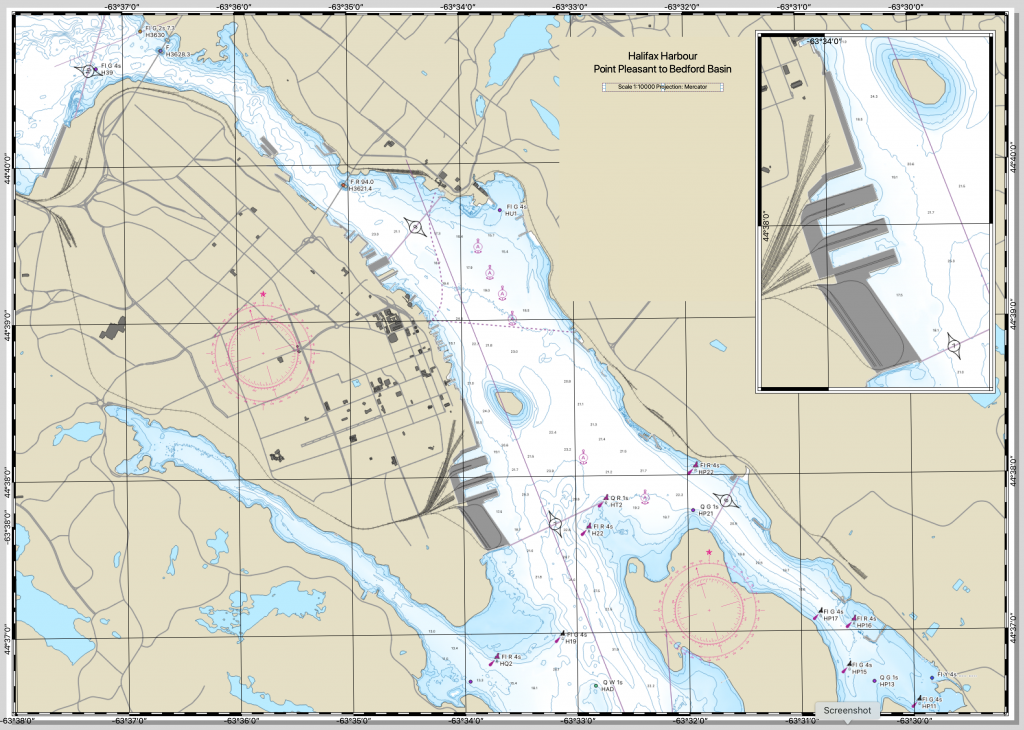
Producing the Chart
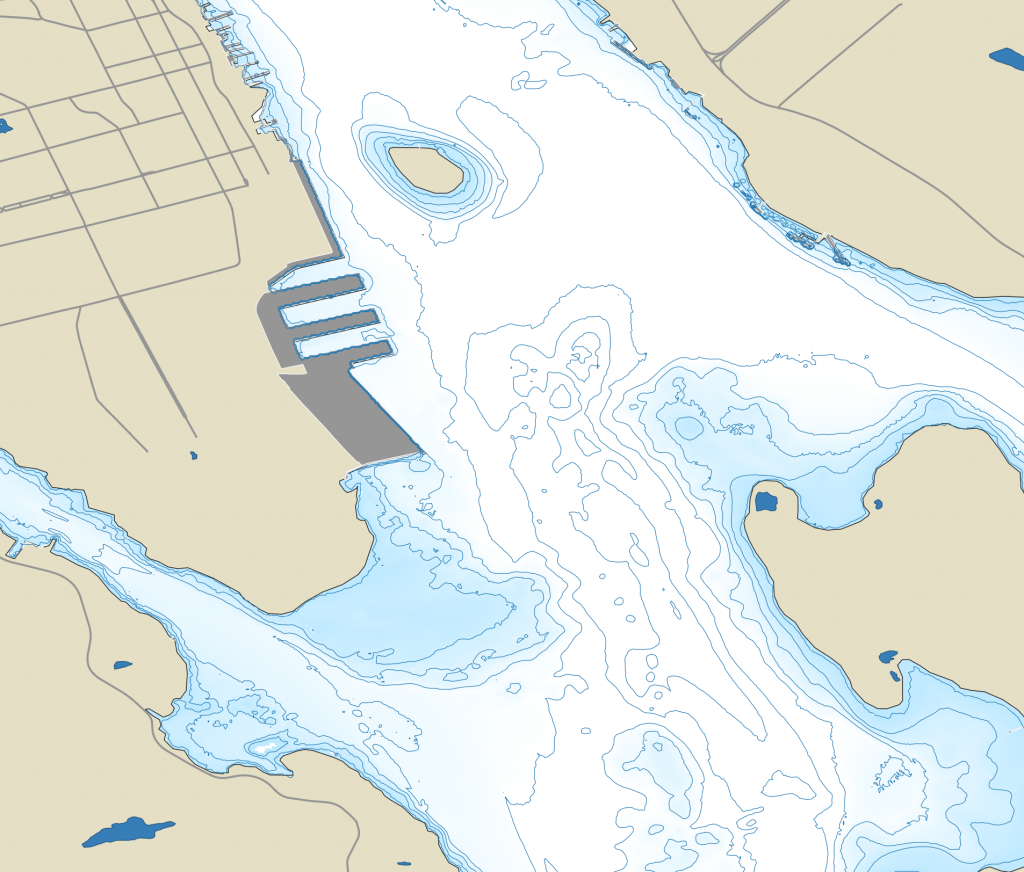
With all the elements digitized, its time to produce the actual chart. In this case we will produce Chart 4202 – Halifax Harbour Point Pleasant to Bedford Basin.
CHS Chart 4202
to Produce the chart, we create a new print layout, i called mine Chart 4202. i edited the page size to be Arch E paper, which is 36×48. add the map box, and the chart will render. Nautical charts are typically 1:10000 scale, so i set the scale to 10000, then adjusted placement so that the inner harbour is covered.
Then we need to change the projection to Mercator. to do so we adjusted the CRS to NAD83 CSRSv6 MTM zone 6
to get the border we want, we add two grids. the first is the standard 1minute interval using a value of 0.016660. we offset by X =20 and y=3 to get the grid to line up to even numbers. The second grid is a frame only, with the X and Y interval set to 0.001666666667 to give us 10ths of a minute. Both grids were done with the Zebra Nautical style. both grids use the WGS84 CRS.
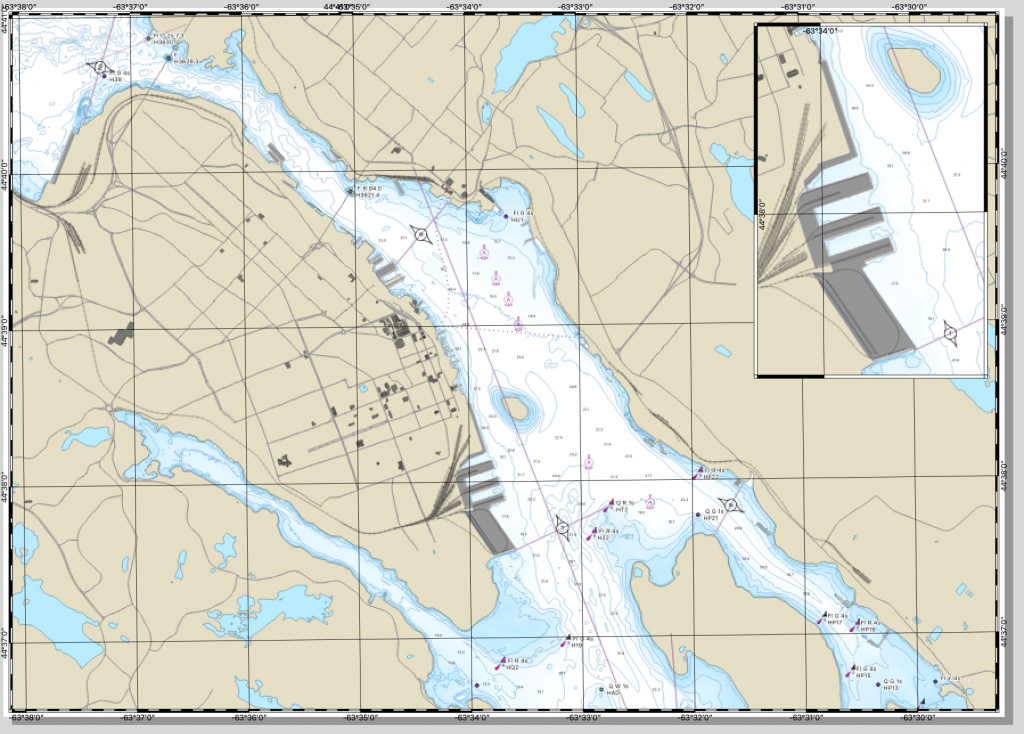
The inset Chart of the South end terminals is created much the same way – its simply a second map window sitting on the first.
from here we can add a couple of compass roses. these are svg images, with the inner getting rotated and set to the correct position.
then all that’s left is the title block, and any additional notes you want to add.
the finished chart
Please note that for the sake of time, not all details were rendered in the chart at this time (Some buoys are not symbolized, not all depths are present. title block is mostly blank, etc.)
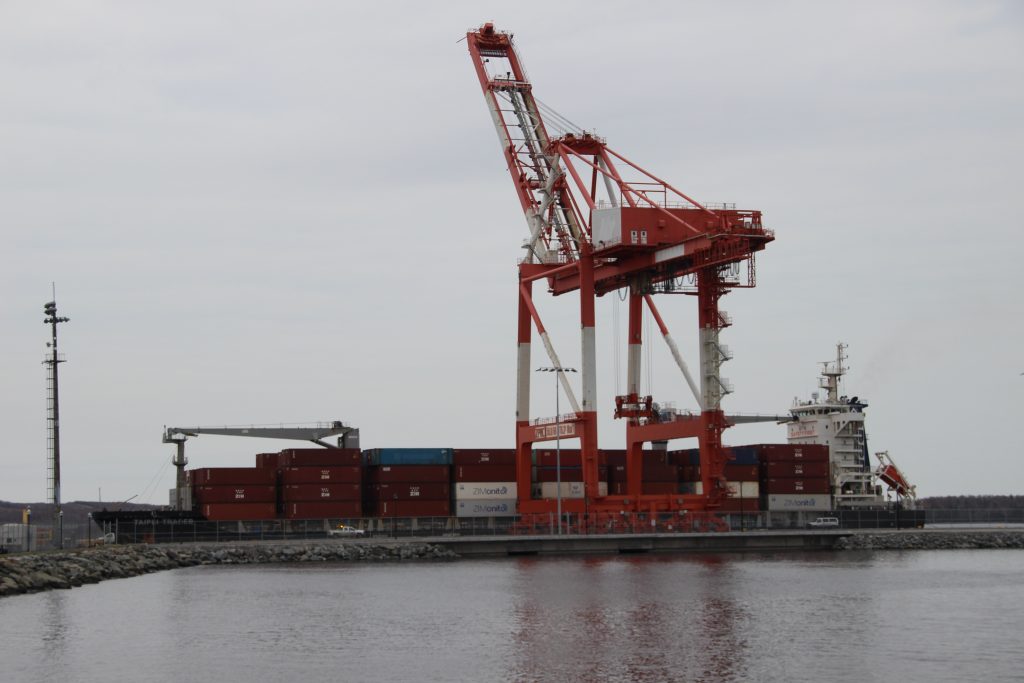
Taipei Trader made good use of the extended pier at PSA Halifax. the ship serves on ZIM’s Feeder service, and Connects Halifax, and New York with ZIMS transshipment facility in Jamaica.
Of note, the ship is facing in the opposite direction to normal.
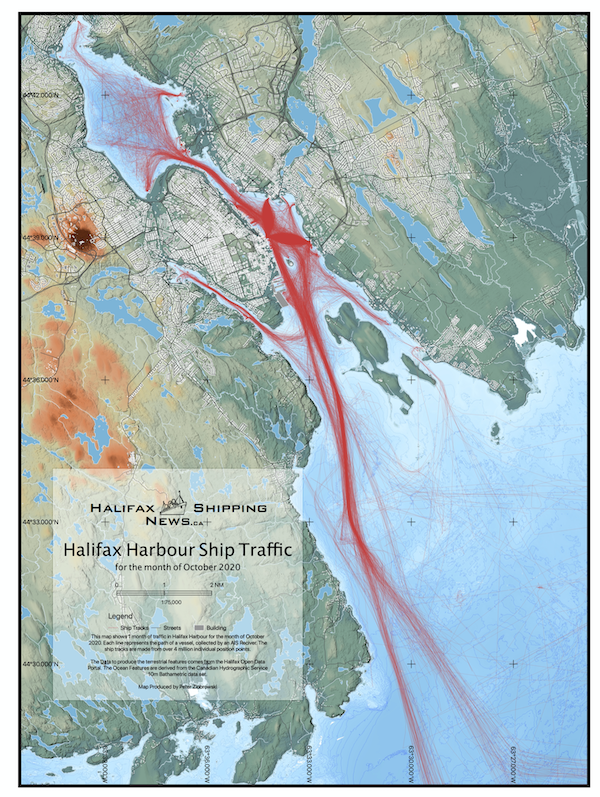
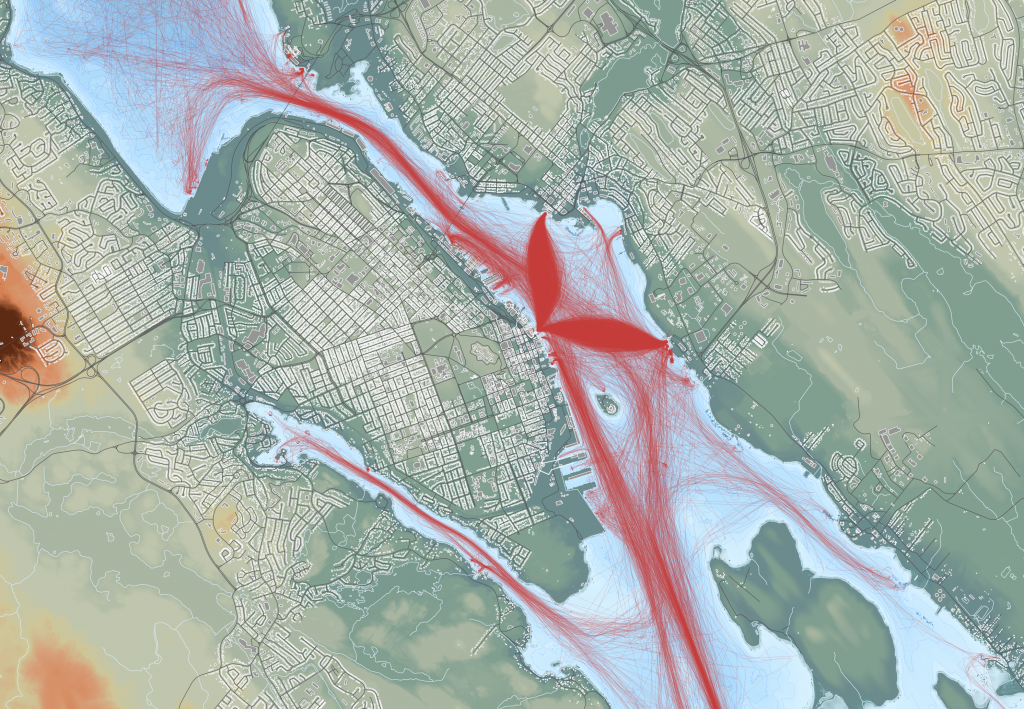
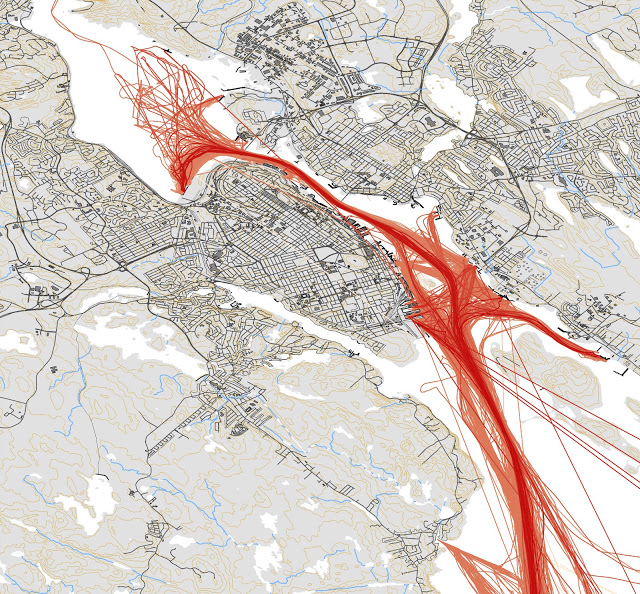
Well, its time for an updated map. This version is based on data from the month of September 2020. Its available as a pdf download (31mb).
2020 brought alot more traffic to be mapped versus the previous 2 versions, based on increased adoption of AIS. The Navy’s tugs now show on AIS, and the new Jetty NJ is in use at the dockyard. COVE has traffic, and Dominion Diving vessels are visible coming out of Dartmouth Cove. The Irving Woodside oil dock is in use, and we have trips to Georges island.
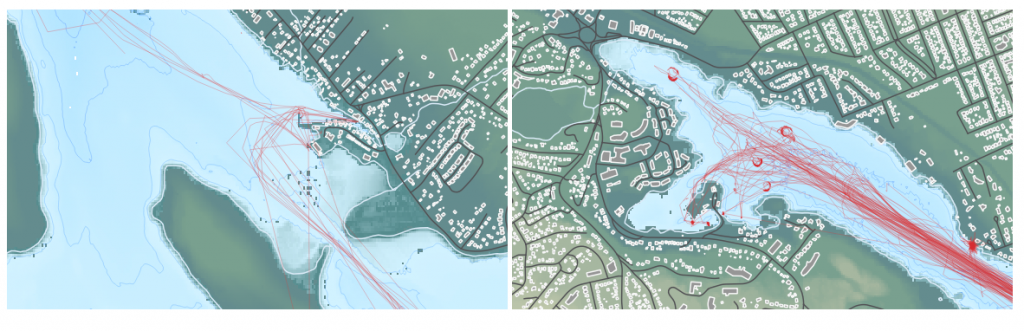
(below left) Fishing vessels in Dartmouth Cove. (below right) Boats at Anchor in the North West Arm.
(below)Boats at the Dartmouth Yacht Club.
The 2020 Map was again made in QGIS, and this time made use of several open data sets. The land is based on the 2018 LIDAR 5m DEM (Digital Elevation Model) coloured to denote elevation. The city is made form the road center lines, coloured dark grey, and the Building Polygon’s, from the Building Outlines data coloured light grey.
The waters of the harbour were built with the CHS NONNA 10 data set. The GeoTiff’s were downloaded, merged into a single file, the colored to show depth. Vector contours were generated, and are visible as a subtle detail in the waters.
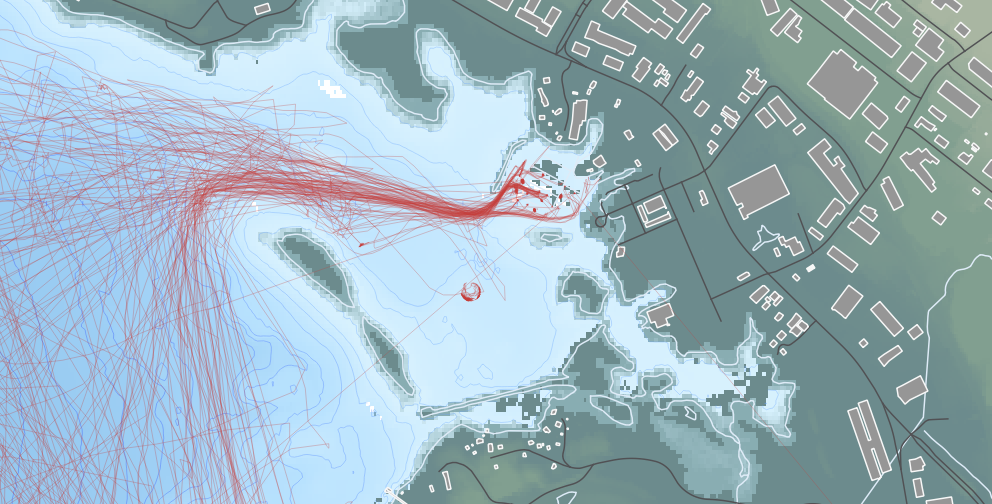
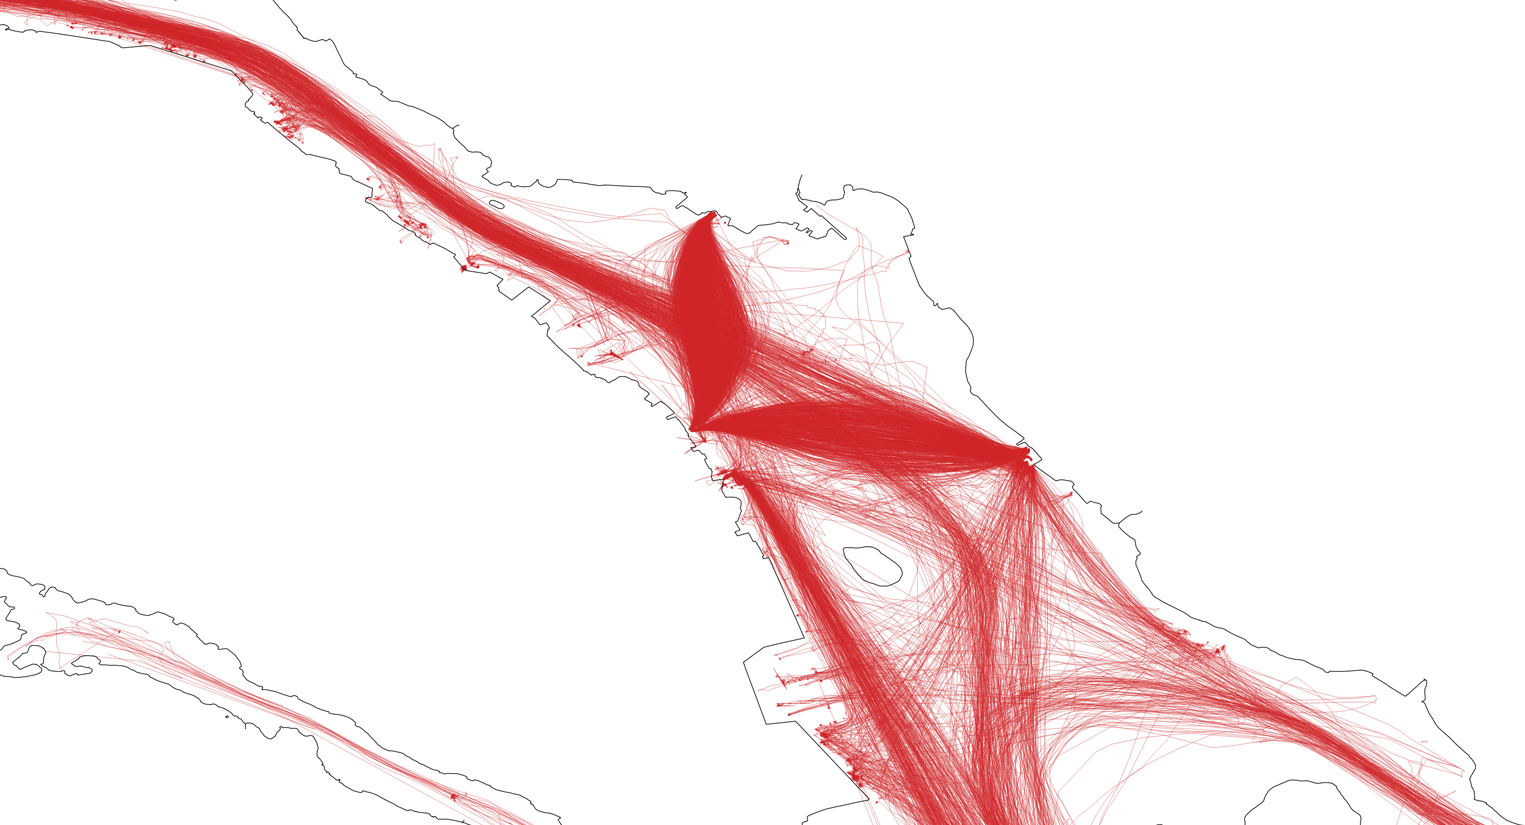
Going Back In time The first map was based on traffic in Nov 2011. COVE was still in use by the coast guard, so traffic is visible. the Ferries are absent, as they didn’t carry AIS in 2011. Imperial Oil is still seeing tanker traffic.
Traffic from Nov 2011.
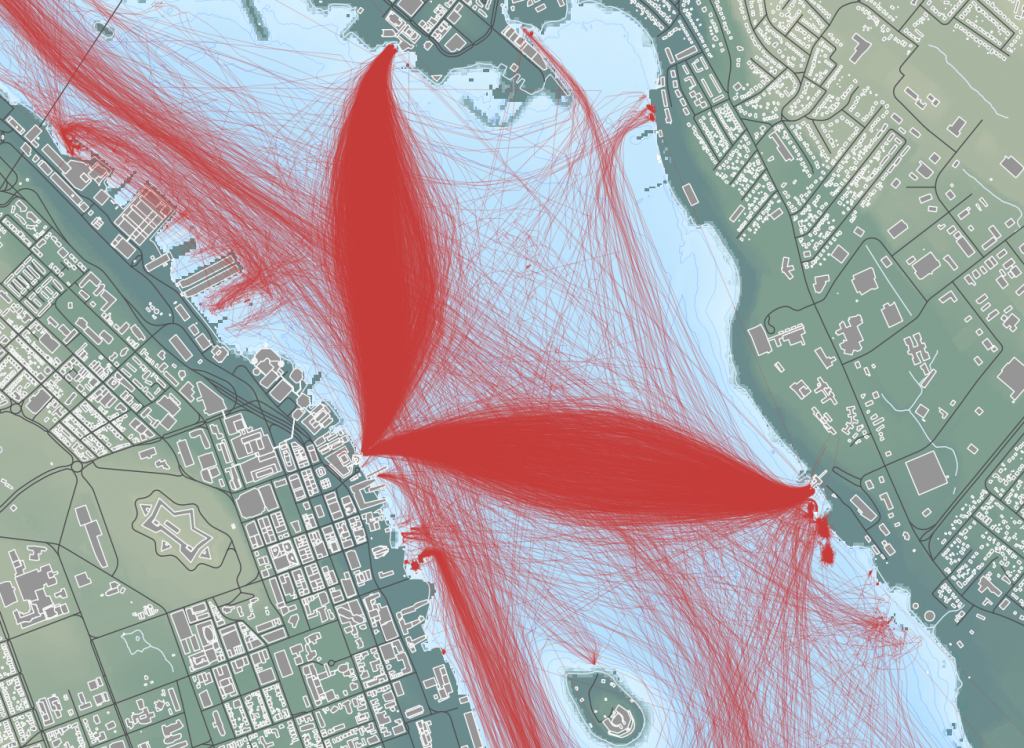
The 2011 map was made in ESRI ArcGIS, and the basemap came from a web mapping service. For 2016, the map was made in QGIS, and the line whights were made finer, with a simpler outline of the harbour.
The traffic in August 2016 is quite different. the Ferries have left a clear Whale tale mark where they cross to Alderney and Woodside. COVE is not yet in regular use, and has limited traffic. There is much less traffic to Imperial oil.
Nautical Mayday is back for Season 2 on the Discovery Channel.
Season 2 of Disasters at Sea Premiers Sunday Evening (Oct 18th). If you missed season 1, you can catch up for free right now on the Discovery Channel website. (or via the app) https://www.discovery.ca/Shows/Disasters-at-Sea
Season 2 of DISASTERS AT SEA starts with the 2006 sinking of B.C. passenger ferry Queen of the North, which struck an underwater ledge off Gil Island carrying 101 passengers – all but two of which were rescued by Gitga’at First Nation residents in Hartley Bay.
The Other 5 Episodes:
The Arctic Rose Mystery , Airing Oct. 25 The catastrophic loss of fishing vessel Arctic Rose is made more mysterious by the fact that only the captain had time to put on his survival suit. Searching for answers, investigators send an ROV to survey the sunken wreck and uncover an intriguing clue that ignites controversy among their own ranks.
Firefight, Airing Nov. 1 A routine ferry trip turns deadly when the MS Norman Atlantic burst into flames, trapping more than 400 passengers on board and killing more than 30 people. Why did a modern passenger ferry catch fire? And why did the evacuation go so wrong?
The Sinking of the Lady Mary, Airing Nov. 8 When a family-owned scallop vessel sinks in the middle of the night, even the lone survivor isn’t sure what happened. Investigators have two mysteries to solve: What sank the Lady Mary, and why did only one person live to tell the tale?
Storm Watch, Airing Nov. 15 The containership SS El Faro goes down just 20 miles from the eye of Hurricane Joaquin killing all 33 of the crew. With the shipwreck and all the evidence at the bottom of the sea, investigators must go to enormous lengths to recover the ship’s black box and find out what went wrong and why?
Death on the Staten Island Ferry, Airing Nov 22 A routine trip on New York’s Staten Island ferry turns deadly when the ship slams into a pier at high speed, killing 11 people and injuring dozens more.
DISASTERS AT SEA is produced in a purpose-built studio in Hamilton, Ont. and on-location throughout Canada and the U.S. The Producers provided a set tour, so you can get a sense of what goes into making the show.
The series, which recently wrapped post-production on Season 3, has been sold in more than 100 markets worldwide, including Eastern and Western Europe, as well as Australia.
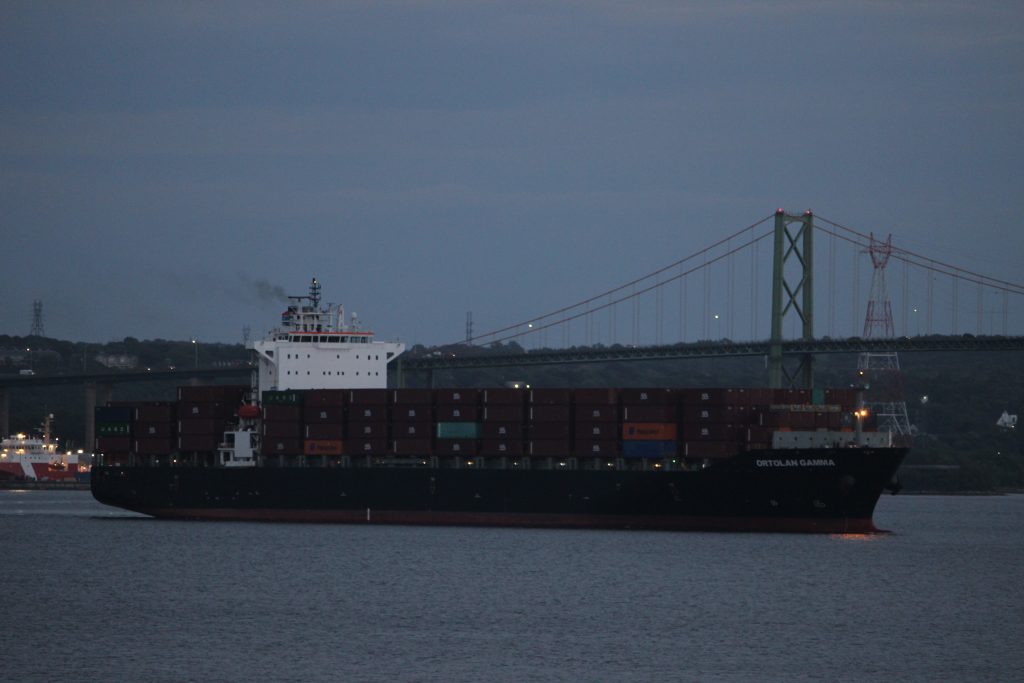
Ortolan Gamma arrived last Friday for ACL filling in for Atlantic Star which is currently at Gdansk, Poland, likely for a work period.
of note, ACL is reflagging its ships. the UK Seafarers union RMT issued a statement:
The ACL fleet was registered in the Port of Liverpool from 2016, when the Atlantic Sea was christened by Princess Anne, the first in Liverpool for fifty years. Yet earlier this week, ACL re-flagged one of its sister ships Atlantic Sky to the Maltese register – a Flag of Convenience and the biggest shipping register in the EU. ACL’s owners Grimaldi Group have warned that the rest of the ACL G4 ships on the Red Ensign are also likely to be re-flagged.
ACL has been threatening to reflag it ships since 2018 over concerns over no deal Brexit. Several other shipping lines have been doing the same. the full release can be found here
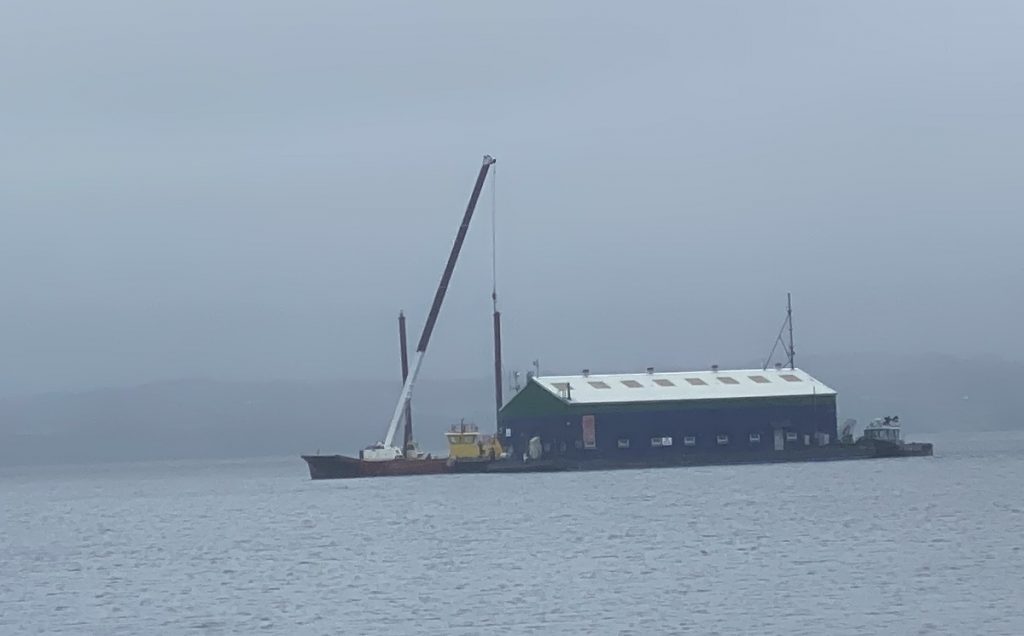
The DRDC Barge has returned to its home in the Bedford Basin. The barge was removed in 2019 for a work period, and its return was delayed until this week for a variety of reasons.